
Description
Présentation de l’indicateur Standard Deviation Channel pour cTrader, un outil puissant conçu pour vous aider à visualiser les tendances du marché avec précision.
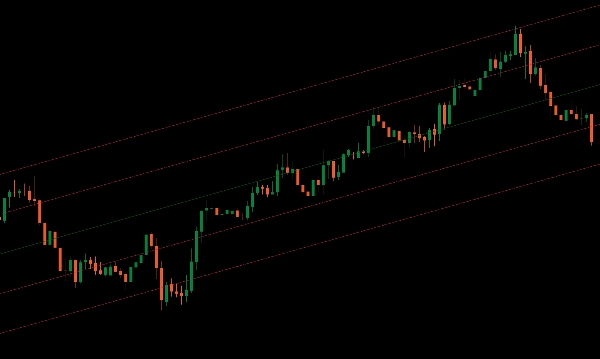
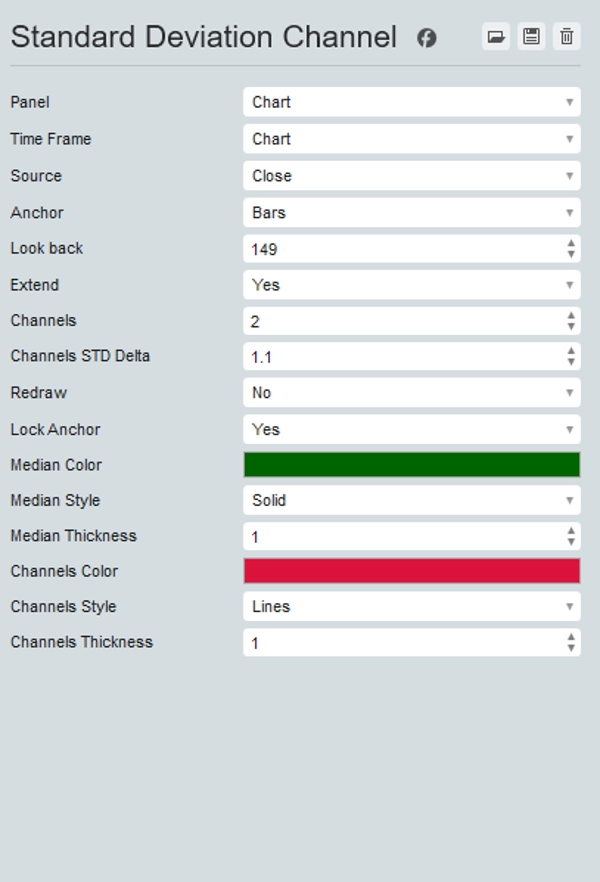
Cet indicateur affiche la médiane d’une période spécifiée sur votre graphique, fournissant un point de référence central pour les mouvements de prix.
De plus, il vous permet d’ajouter un nombre souhaité de canaux supérieurs et inférieurs à des multiples de l’écart-type, vous offrant une vue claire de la volatilité des prix et des zones potentielles de rupture.
Parfait pour les traders recherchant des capacités analytiques améliorées, l’indicateur Standard Deviation Channel vous aide à identifier facilement les directions de tendance et les points de retournement potentiels.
Améliorez votre boîte à outils de trading avec le Standard Deviation Channel pour une analyse de marché et une prise de décision supérieures.
Résumé
Avis clients
5 | 100 % | |
4 | 0 % | |
3 | 0 % | |
2 | 0 % | |
1 | 0 % |


