
Description
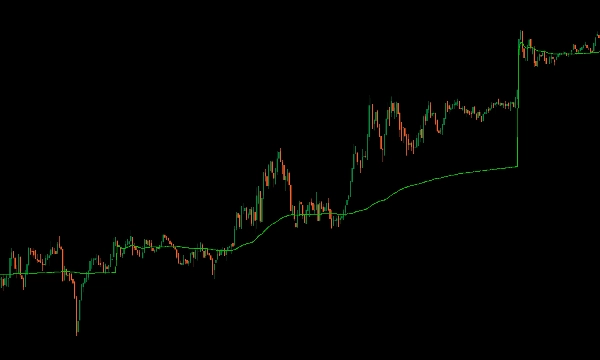
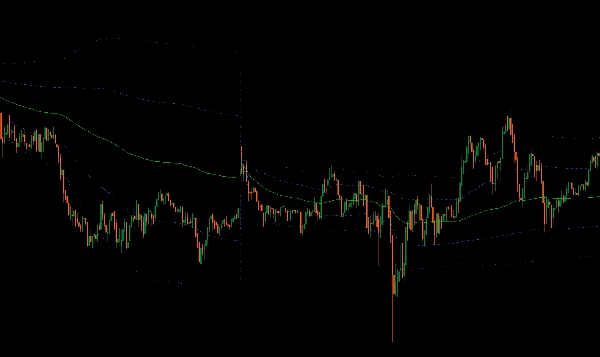
Présentation de l'indicateur VWAP pour cTrader, apportant toute la fonctionnalité du Volume Weighted Average Price de TradingView à votre plateforme de trading.
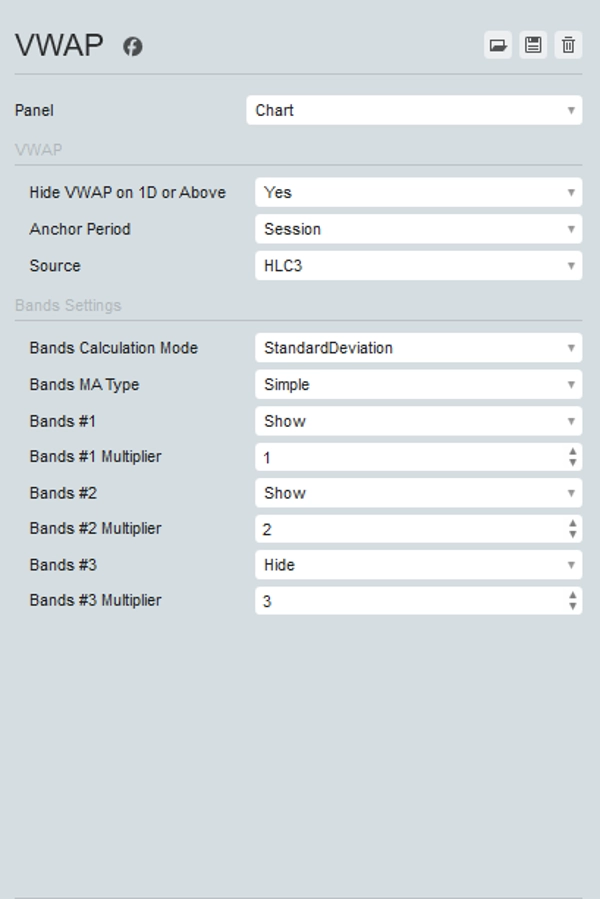
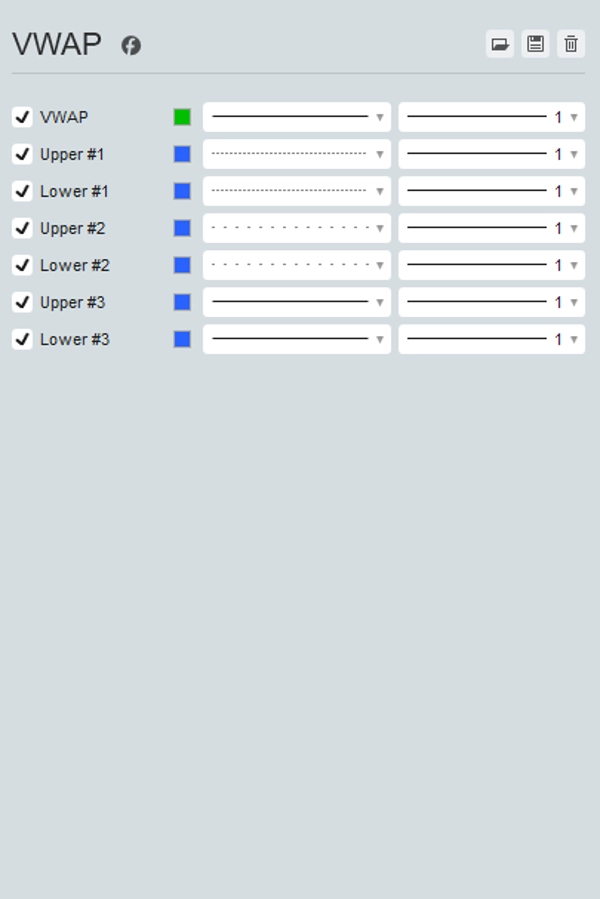
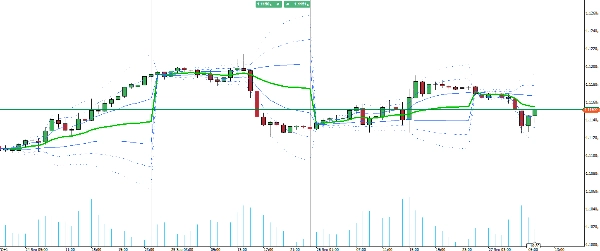
Cet outil complet vous permet de choisir votre période d'ancrage (Session, Semaine, Mois, Trimestre, Année) et de sélectionner parmi diverses sources de prix, y compris Open, High, Low, Close, HL2, HLC3, OHLC4, et HLCC4. De plus, il peut afficher jusqu'à trois bandes supérieures et inférieures d'écart type, offrant une vue complète de la distribution des prix.
L'indicateur VWAP se met à jour en temps réel avec les données tick, garantissant que vous disposez des informations les plus précises et les plus récentes pour vos décisions de trading. Améliorez votre stratégie de trading avec l'indicateur VWAP polyvalent et puissant dans cTrader.
Résumé
Avis clients
5 | 67 % | |
4 | 33 % | |
3 | 0 % | |
2 | 0 % | |
1 | 0 % |


![Logo de "High-Low Divergence [Iridio Capital]"](https://cdn.ctrader.com/image/webp/443c4661-7abb-40f1-842f-4b6ec560649b_40914)


