
Description
Présentation de l’indice de force réelle (TSI), un outil puissant conçu pour améliorer votre stratégie de trading en fournissant des informations claires sur le momentum du marché et la force de la tendance.
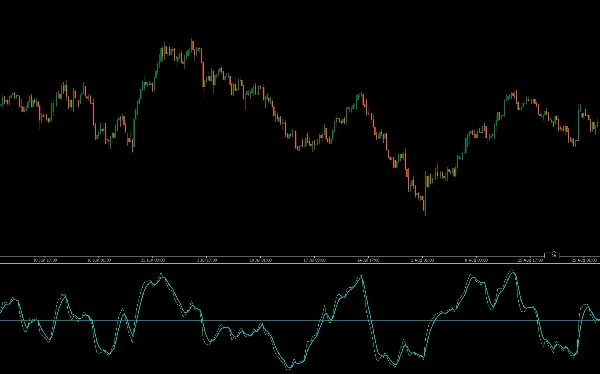
L’indicateur TSI mesure la force sous-jacente des mouvements de prix, en lissant le bruit du marché pour vous donner une image plus précise de la direction de la tendance. En mettant en évidence les conditions de surachat et de survente, le TSI vous aide à identifier les points de retournement potentiels et à confirmer les continuations de tendance.
Le TSI utilise des moyennes mobiles du momentum sous-jacent d’un instrument financier. Le momentum est considéré comme un indicateur avancé des mouvements de prix, et une moyenne mobile suit généralement le prix avec un certain retard. Le TSI combine ces caractéristiques pour créer une indication du prix et de la direction plus synchronisée avec les retournements du marché que le momentum ou la moyenne mobile seuls.
Parfait pour les traders cherchant à affiner leur analyse et améliorer la prise de décision, l’indicateur TSI offre un moyen fiable et intuitif d’évaluer la dynamique du marché. Améliorez votre boîte à outils de trading avec l’indice de force réelle pour une performance de trading supérieure.
- Identification de la tendance : Un TSI positif indique une tendance haussière, tandis qu’un TSI négatif suggère une tendance baissière.
- Force du momentum : Il mesure la force avec laquelle une tendance évolue, des valeurs plus élevées indiquant un momentum plus fort.
- Signaux potentiels de retournement :
-
- Croisements : Un croisement de la ligne de signal près de la ligne zéro peut indiquer des points d’entrée et de sortie potentiels.
- Divergence : Lorsque le prix atteint un nouveau sommet ou creux, mais que le TSI ne le fait pas, cela peut signaler un retournement de tendance potentiel.
- Conditions de surachat/survente : Il peut aider à identifier quand un actif peut être suracheté ou survendu, bien que les niveaux spécifiques de surachat et de survente puissent varier en fonction de la volatilité de l’actif.
Résumé
Avis clients
5 | 0 % | |
4 | 100 % | |
3 | 0 % | |
2 | 0 % | |
1 | 0 % |


