
UT Bot Alert
Indicateur
9 achats
Version 1.0, Sep 2025
Windows, Mac
5.0
Avis : 3
Description
UT Bot Alerts est un indicateur de trading sophistiqué conçu pour couper à travers le bruit du marché. En utilisant la Moyenne de la Vraie Plage (ATR) et un filtre Heikin Ashi optionnel, il fournit des signaux d'achat et de vente à haute probabilité directement sur votre graphique. Cet outil est conçu pour les traders recherchant clarté et précision dans toutes les conditions de marché.
Caractéristiques principales :
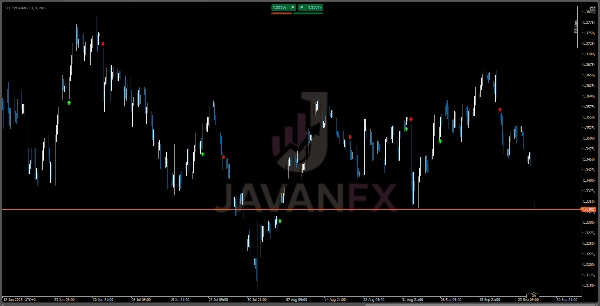
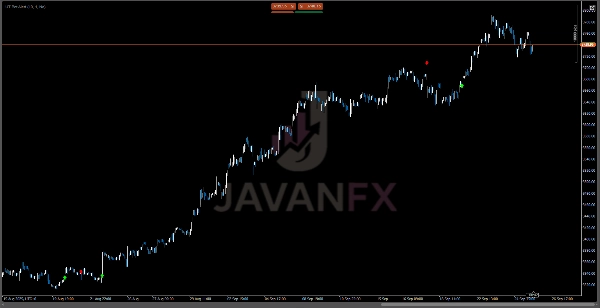
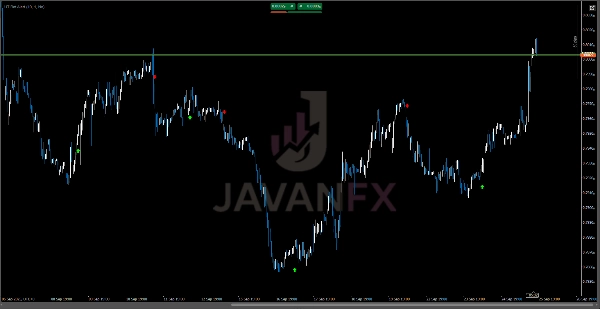
- Signaux Visuels Clairs : Des flèches et des points de tendance faciles à repérer indiquent les points d'entrée et de sortie optimaux.
- Lissage Heikin Ashi : Paramètre optionnel pour générer des signaux encore plus nets en filtrant les petites fluctuations de prix.
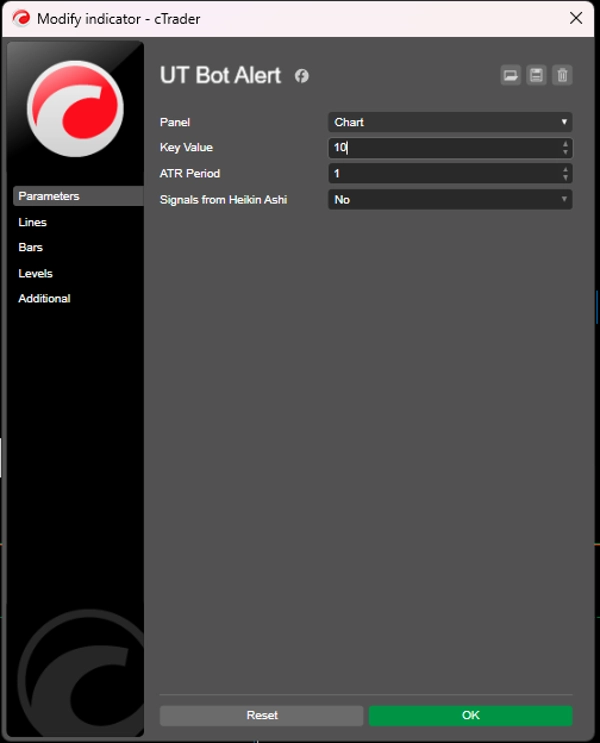
- Entièrement Personnalisable : Ajustez la période de l'ATR et la "Valeur Clé" principale pour correspondre à la volatilité de l'instrument et à votre appétit personnel pour le risque.
- Alertes en Temps Réel : Recevez des notifications instantanées par pop-up, email et mobile pour de nouvelles opportunités de trading, afin de ne jamais manquer un signal.
Pourquoi les traders aiment UT Bot Alerts :
- 📈 Améliorez la Précision : Identifiez les retournements et les continuations de tendance potentiels avec une méthodologie éprouvée basée sur l'ATR.
- ⏳ Tradez avec Discipline : Réduisez les décisions émotionnelles et évitez le sur-trading en attendant des configurations confirmées.
- 🎯 Polyvalence Multi-Marchés : Efficace sur les paires forex, les cryptomonnaies, les actions, les indices et les matières premières.
- ⚙️ Paramètres Personnalisés : Affinez la sensibilité pour créer une stratégie adaptée à votre style, du scalping au swing trading.
Avertissement : Les performances passées ne préjugent pas nécessairement des résultats futurs.
Résumé
Résumé IA
UT Bot Alert is an ATR-based trading indicator designed to provide clear BUY and SELL signals across multiple markets, including forex, stocks, indices, commodities, and cryptocurrencies. It uses the Average True Range (ATR) metric combined with an optional Heikin Ashi filter to reduce market noise and enhance signal accuracy. The indicator displays easy-to-interpret visual cues such as arrows and trend dots on the chart to mark optimal entry and exit points.
Key features include customizable ATR periods and sensitivity settings, allowing traders to tailor the indicator to different instruments and personal risk preferences. Real-time alerts are available via pop-up, email, and mobile notifications to promptly inform users of new trading opportunities. The tool supports various trading styles, from scalping to swing trading, by enabling fine-tuning of signal sensitivity.
UT Bot Alert aims to help traders identify potential trend reversals and continuations with improved precision, promoting disciplined trading by waiting for confirmed setups. Its multi-market versatility and customizable parameters make it adaptable to diverse trading environments and strategies.
Profil de l'indicateur
Avis clients
5.0
Avis : 3
5 | 100 % | |
4 | 0 % | |
3 | 0 % | |
2 | 0 % | |
1 | 0 % |
Avis clients
October 10, 2025
Solid tool! 🚀 UT Bot Alert nails trend shifts with clean signals & low lag. Easy to read, perfect for scalps and swings alike — just tune the ATR a bit for your pair and you’re set.
October 9, 2025
October 6, 2025
The useful bit is the idea has to earn the click. The chart still deserves a proper look.
Discussion
Questions fréquentes
Forex
Signal
Scalping
Indices
Commodities
Stocks
ATR
Les produits disponibles sur cTrader Store, notamment les bots de trading, les indicateurs et les plug-ins, sont fournis par des développeurs tiers et mis à disposition à titre informatif et à des fins d'accès technique uniquement. cTrader Store n'est pas un courtier et ne fournit aucun conseil en investissement, aucune recommandation personnelle ni aucune garantie quant aux performances futures.


Prix
Depuis le 14/07/2025
60
Ventes