
Description
L’Indice de Force de Direction de Tendance (TDFI) est un indicateur puissant basé sur le momentum conçu pour aider les traders à identifier avec précision les mouvements de tendance forts et les retournements potentiels. En analysant la relation entre deux moyennes mobiles et leur taux de variation, le TDFI filtre le bruit du marché et met en évidence des opportunités de trading à haute probabilité.
Caractéristiques clés :
✅ Identification claire de la tendance – Distingue visuellement le momentum haussier (vert) et baissier (rouge) selon des seuils personnalisables.
✅ Lissage adaptatif – Utilise plusieurs types de moyennes mobiles (EMA, WMA, Hull, TEMA, etc.) pour une réactivité optimale.
✅ Réduction du bruit – La normalisation dynamique garantit que seules les variations de prix significatives déclenchent des signaux.
✅ Alertes personnalisables – Recevez des notifications en temps réel lorsque les tendances se renforcent ou s’inversent.
✅ Fonctionne sur toutes les périodes – Efficace pour le scalping, le day trading et le swing trading.
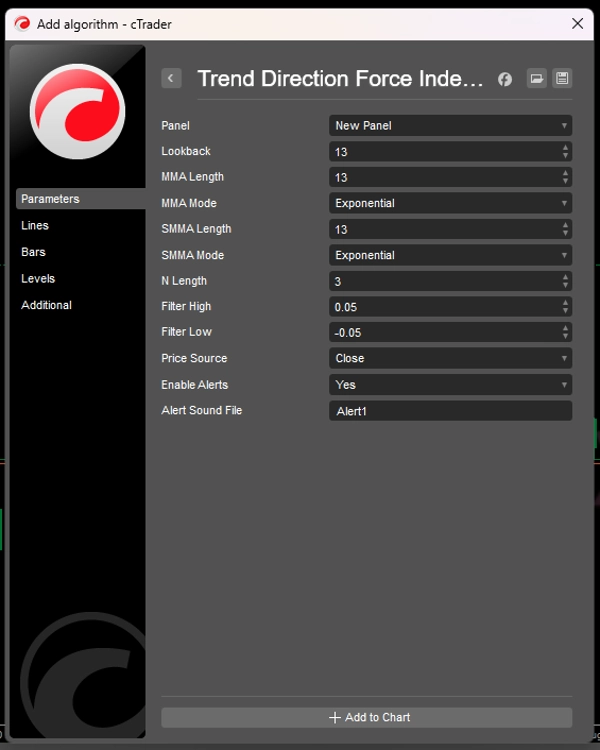
Comment fonctionne le TDFI
Le TDFI mesure la force de la tendance en analysant la divergence et le momentum entre deux moyennes mobiles spécialement ajustées :
- MMA (Moyenne Mobile Principale) – Suit le momentum des prix à court terme
- SMMA (Moyenne Mobile Lissée) – Identifie la tendance sous-jacente
L’indicateur calcule ensuite :
🔹 Force de divergence – La distance entre les MMA (force de la tendance)
🔹 Accélération du momentum – La rapidité du mouvement de la tendance
🔹 Sortie normalisée – Échelle des signaux pour éviter les valeurs extrêmes
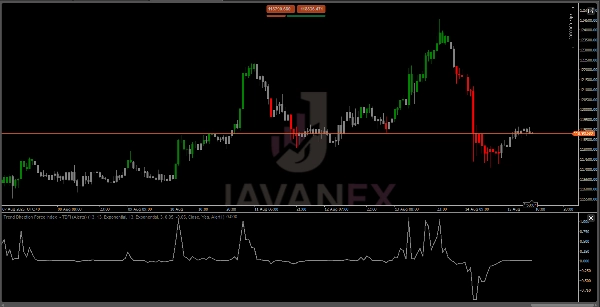
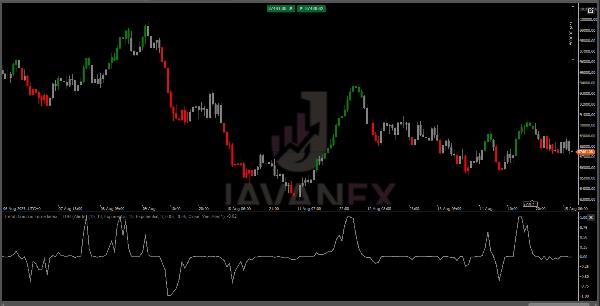
Lorsque ces forces se combinent :
- TDFI > Seuil supérieur (Vert) = Momentum haussier fort
- TDFI < Seuil inférieur (Rouge) = Momentum baissier fort
- Entre les seuils (Gris) = Neutre/consolidation
Résumé
Avis clients
5 | 75 % | |
4 | 25 % | |
3 | 0 % | |
2 | 0 % | |
1 | 0 % |


