
Description
Ce n'est pas votre indicateur Delta de Volume typique. C'est l'indicateur Delta de Volume DOM Niveau 2 — Flux d'ordres de qualité institutionnelle pour cTrader. L'avantage pour lequel les institutions paient des millions.
Le problème auquel chaque trader particulier est confronté. Une bougie se ferme en vert. Le volume est élevé. Vous achetez.
Le prix inverse instantanément. Vous êtes stoppé. Le graphique vous a "menti".
Il n'a pas menti — vous ne pouviez tout simplement pas voir ce qui se passait à l'intérieur de la bougie. Cette barre verte avec un volume élevé ? 70 % de ce volume était une vente agressive. La clôture était soutenue par une fine couche d'ordres d'achat au bas de la plage. Les institutions distribuaient dans votre ordre d'achat.
Les indicateurs de volume standard vous montrent le total. Ils ne vous montrent jamais qui était aux commandes.
Le Delta de Volume change cela. Ce que le Delta de Volume vous montre réellement
Le Delta de Volume sépare le volume de chaque barre en volume d'achat et volume de vente, puis calcule la différence — le delta. Un delta positif signifie que les acheteurs étaient plus agressifs. Un delta négatif signifie que les vendeurs dominaient.
C'est l'information la plus importante qui sépare les traders professionnels des traders particuliers : pas combien a été échangé, mais quel côté a négocié plus agressivement. C'est la conviction. Le delta est l'empreinte de l'intention derrière chaque barre de prix.
Mais cela ne s'arrête pas là
Cet indicateur ne devine pas. Dans un mélange propriétaire de données, il lit les données de profondeur de marché Niveau 2 — le carnet d'ordres réel derrière le prix que vous voyez à l'écran.
Les données Niveau 2 (également connues sous le nom de DOM — Depth of Market) montrent les vrais ordres d'achat et de vente empilés à chaque niveau de prix. Pas la dernière transaction. Pas une estimation. La liquidité réelle en attente provenant des banques, fonds spéculatifs et desks institutionnels circulant via les fournisseurs de liquidité de votre courtier.
Le résultat est un niveau de précision de 85-95% dans la classification du volume d'achat versus vente — bien au-delà de ce que toute approximation basée sur une formule peut atteindre.
Pourquoi c'est important — Ce que les institutions voient que vous ne voyez pas
Goldman Sachs, Citadel, Jump Trading — ils négocient tous avec des données de flux d'ordres. Ils voient la pression d'achat et de vente en temps réel. Ils voient l'absorption. Ils voient quand un niveau est défendu. Ils voient quand le delta diverge du prix.
Ils paient des millions pour cette infrastructure. Les flux de données, les serveurs co-localisés, les outils propriétaires.
Cet indicateur apporte le même concept central à votre graphique cTrader. Pas une version édulcorée. Les données DOM Niveau 2 réelles de la piscine de liquidité de votre courtier, traitées dans la même classification achat versus vente que les traders professionnels de flux d'ordres utilisent.
La différence entre un trader particulier et un trader institutionnel n'est pas l'intelligence. C'est l'information. Le Delta de Volume comble cet écart.
Pour qui c'est
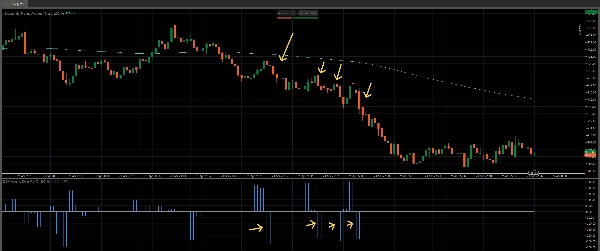
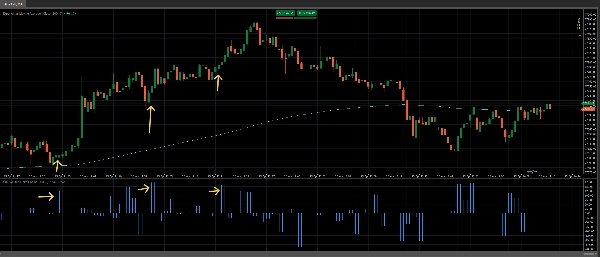
Les day traders qui veulent voir au-delà du bruit. Quand une bougie semble haussière mais que le delta est négatif, vous savez qu'il faut attendre. Quand une bougie semble faible mais que le delta est fortement positif, vous savez que les institutions accumulent. Le delta ne ment pas — il montre ce qui s'est passé, pas ce que cela semblait être.
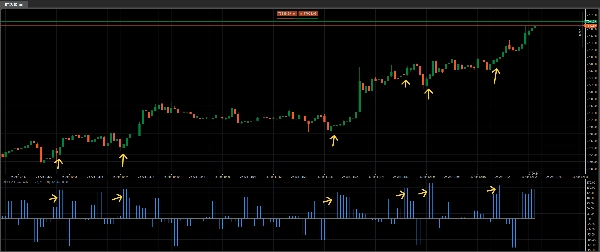
Les scalpers qui ont besoin de savoir quel côté est aux commandes à l'instant. Un pic de delta lors d'une cassure confirme qu'elle est réelle. Une cassure avec un delta plat vous indique que c'est un piège avant même que le retournement ne commence.
Les swing traders qui veulent de la confluence. Les divergences de delta — où le prix fait un nouveau plus bas mais le delta monte — sont parmi les signaux de retournement les plus fiables en trading professionnel. Cet indicateur les détecte automatiquement.
Tous ceux qui tradent le forex, les indices ou les matières premières sur cTrader avec un courtier qui fournit des données Niveau 2. Fusion Markets, IC Markets, Go Markets et des courtiers ECN/STP similaires fournissent tous les données DOM que cet indicateur lit.
Si vous avez déjà été du mauvais côté d'une bougie à "volume élevé", c'est l'outil qui vous explique pourquoi.
Ce que vous obtenez
Un histogramme propre et professionnel sous votre graphique montrant le delta net pour chaque barre, basé sur des données très précises. Les barres positives signifient que les acheteurs dominaient. Les barres négatives signifient que les vendeurs dominaient. La taille de la barre vous montre combien un côté a surpassé l'autre. Utilisé avec des indicateurs comme la moyenne mobile 200 ema, cela donne de la confluence et des configurations à haute probabilité.
Pas de désordre. Pas de moyennes mobiles retardées du volume. Pas de bougies colorées qui "estiment" l'achat et la vente. Juste la différence brute et non filtrée entre achat agressif et vente agressive — calculée à partir de la source de données la plus profonde disponible pour les traders particuliers.
Cet indicateur offre également l'option d'utiliser un filtre de volume pour ne montrer que les barres les plus importantes. Agréger les barres de volume si désiré.
Un seul regard sur la barre delta vous dit ce que dix autres indicateurs essaient d'approcher. Procurez-vous le vôtre maintenant pour cTrader. C'est une évidence à ce prix bas.
Combinez ceci avec notre indicateur Volume Profile Pro pour des décisions encore mieux informées aux niveaux clés : https://ctrader.com/products/4079
Découvrez notre incroyable Black Box Bot ici : https://ctrader.com/products/3241
Résumé
The indicator displays a clean histogram below the chart representing net volume delta per bar: positive bars indicate buyer dominance, negative bars indicate seller dominance, and bar size reflects the strength of that dominance. This provides traders with insight into market intent beyond total volume, revealing whether buyers or sellers controlled the price action.
It supports forex, indices, and commodities trading with brokers offering Level 2 data, such as Fusion Markets and IC Markets. Features include volume filtering and aggregated volume bars. The tool is suited for day traders, scalpers, and swing traders seeking to interpret order flow, confirm breakouts, detect divergences, and enhance decision-making with professional-level order flow data.
Avis clients
5 | 50 % | |
4 | 50 % | |
3 | 0 % | |
2 | 0 % | |
1 | 0 % |


![Logo de "[Stellar Strategies] Market Session Ultimate"](https://cdn.ctrader.com/image/webp/61ffd537-0125-4246-9e72-42eca1791d64_28232)


