
Description
🏆 Plus de 10 000 traders font confiance à notre suite de plus de 25 algorithmes ! 🏆
De Structure du marché & Liquidité à Systèmes de sortie intelligents & Outils prédictifs - nous avons construit TOUS les outils dont vous avez besoin pour être constant.
👉 Accédez à tous les 25+ systèmes PROUVÉS :
_______________________________________________
📌 Indicateurs de structure du marché
· 🔄 Analyse dynamique de la structure du marché des points de retournement
· 🧱 Bloc d'ordre
· ⛓️ BOS & CHOCH
· 🧠 ICT Power of 3
· 🌀 Zones de polarité du marché
_______________________________________________
🔚 Systèmes de sortie intelligents
· 📍 Algorithme intelligent de suivi
_______________________________________________
📐 Indicateurs ZigZag
· 🔍 Projection de liquidité des prix ZigZag
· ➖ ZigZag
· 🎯 Suivi des extrémités Zig-Zag
_______________________________________________
🧱 Indicateurs de support & résistance
· 🟩 Lignes de support & résistance SmartTrend
· 🧱 Tous les niveaux de support et résistance
_______________________________________________
📊 Indicateurs de tendance & de canal
· 🔄 Canal de tendance automatique
· 📊 Supertrend
· ⚡Analyseur de tendance Momentum
· 🧠 Canal de tendance adaptatif
· 💥 Système de cassure de canal
· 🌈 Gradient de tendance dynamique
_______________________________________________
💧 Outils de volume & de liquidité
· 🔥 Carte thermique Volume POC
· 📉 Carte de liquidation à effet de levier
· 🕒 Sessions de Fair Value Gap
_______________________________________________
⚡ Indicateurs Momentum & RSI
· 📈 Déclencheur de tendance RSI
· 🚀 Momentum à plage dynamique
· 🔎 Suivi du biais multi-niveaux des chandeliers
Tracker
_______________________________________________
🔮 Outils de prédiction & de projection
· 📐 Prédiction basée sur Linreg & ATR
· 📏 Régression linéaire de Fibonacci multi-échelles
· 📈 Projecteur de flux de marché alimenté par le volume_________________________
_________________________________________________________________________________________________
_________________________________________________________________________________________________
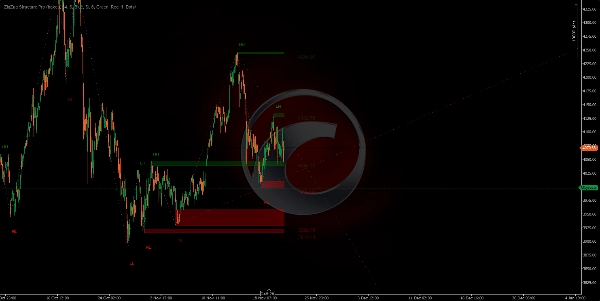
ZigZag Structure Pro – 🚀
Identifie automatiquement les points de retournement importants du marché (hauts et bas clés) et trace des zones dynamiques de support et de résistance qui se mettent à jour en temps réel. 🎯 Contrairement aux niveaux statiques traditionnels, cet indicateur s'adapte constamment à la structure des prix changeante.
À quoi ça sert ? ❓
Cet indicateur est un outil professionnel d'analyse technique conçu pour :
- Identifier les niveaux institutionnels : 🏛️ Détecte automatiquement les points où le prix a formé des structures hautes et basses importantes.
- Analyse de la structure du marché : 📊 Classe chaque mouvement selon la méthodologie de structure haussière/baissière (plus hauts plus hauts, plus bas plus bas, etc.).
- Projection de tendance : 🔮 Prolonge les lignes de tendance dans le futur pour anticiper les zones potentielles de réaction des prix.
- Trading des retournements et des continuations : 💰 Les niveaux marqués servent de référence pour les entrées, stop-loss et objectifs de profit.
L'indicateur trace sur votre graphique : ✍️
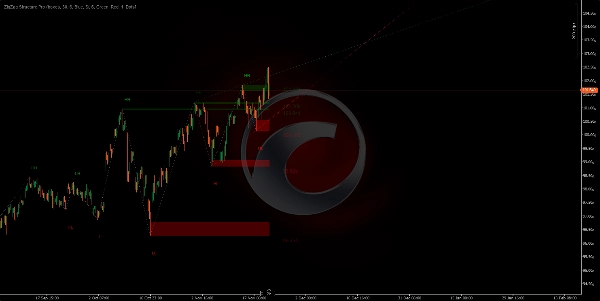
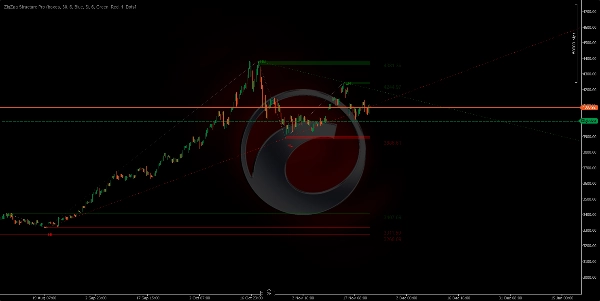
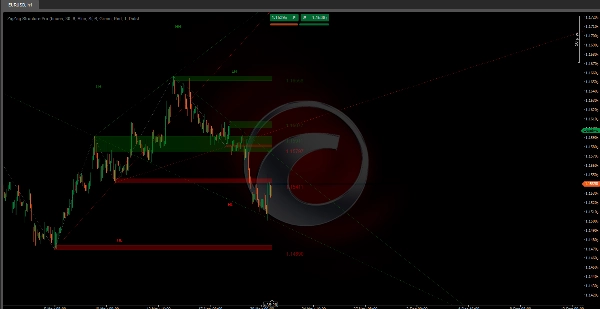
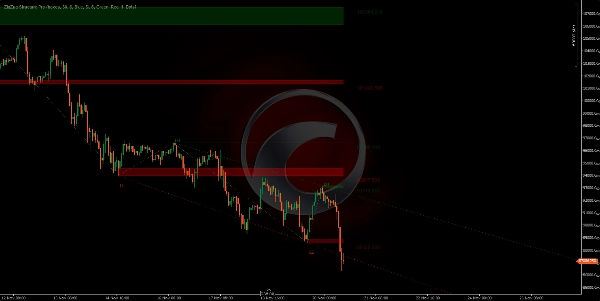
1. Zones de support/résistance (rectangles)
- Zones vertes : 🟢 Marquent les zones de support (bas significatifs où le prix pourrait rebondir).
- Zones rouges : 🔴 Marquent les zones de résistance (hauts significatifs où le prix pourrait reculer).
- Ces zones sont projetées vers l'avant, montrant les niveaux actifs actuels.
- L’ épaisseur de chaque zone représente le corps de la bougie où le pivot a été formé.
https://chartshots.spotware.com/c/691f5a4d75ac4
https://chartshots.spotware.com/c/691f6b4f2e98b
https://chartshots.spotware.com/c/691f6c6fda808
https://chartshots.spotware.com/c/691f6d0aa6155
2. Lignes de connexion ⚡
- Relie chaque pivot au suivant, créant un motif visuel en "zigzag".
- Élimine le bruit du marché, ne montrant que les mouvements vraiment significatifs.
- Facilite la visualisation de la direction et de la structure de la tendance en un coup d'œil.
3. Lignes de tendance projetées (vertes/rouges étendues)
- Dessiné du pivot précédent au pivot actuel et étendu dans le futur.
- Vert : 🟢 Lignes de tendance haussière (depuis les bas).
- Rouge : 🔴 Lignes de tendance baissière (depuis les hauts).
- Montre les 2 lignes de tendance les plus récentes et actives.
- Utile pour détecter les cassures ou respects de tendance.
4. Étiquettes de structure du marché 🏷️
Chaque pivot affiche une étiquette indiquant sa classification :
- HH (Higher High) : ↗️ Plus haut plus haut - continuation haussière.
- LH (Lower High) : ⬆️ Plus haut plus bas - possible retournement baissier.
- HL (Higher Low) : ⬇️ Plus bas plus haut - possible retournement haussier.
- LL (Lower Low) : ↘️ Plus bas plus bas - continuation baissière.
Logique derrière l'algorithme 🧠
L'indicateur utilise un algorithme zigzag adaptatif qui :
- Analyse le prix à la recherche de hauts et bas sur une période configurable (par défaut 34 barres).
- Filtre les mouvements insignifiants via un seuil de déviation minimum (par défaut 6 pips).
- Valide chaque pivot en s'assurant qu'il représente un vrai changement dans la structure du marché.
- Compare les structures entre pivots consécutifs pour classifier le type de mouvement.
- Met à jour dynamiquement les zones au fur et à mesure que de nouveaux pivots apparaissent, supprimant les plus anciens.
Paramètres principaux ⚙️
- Barres de retour en arrière du pivot : Contrôle la sensibilité du détecteur de pivot (plus bas = plus de pivots, plus haut = uniquement les pivots majeurs).
- Filtre de déviation du prix : Filtre de bruit - les mouvements plus petits que cette valeur sont ignorés.
- Nombre maximum de zones visibles : Nombre de niveaux historiques qui restent visibles (de 1 à 20).
- Type d'affichage des zones : Choix entre rectangles (zones complètes) ou lignes simples.
- Afficher les lignes de tendance étendues : Activer/désactiver les projections de tendance.
Guide rapide des paramètres 📖
Barres de retour en arrière du pivot (Par défaut : 30)
- ↑ Augmenter (40-100) : MOINS de pivots, plus importants. Pour le swing trading.
- ↓ Diminuer (15-25) : PLUS de pivots, plus de signaux. Pour le scalping/day trading.
Filtre de déviation du prix (Par défaut : 6)
- ↑ Augmenter (8-15) : Filtre le bruit, seuls les grands mouvements. Moins de signaux, meilleure qualité.
- ↓ Diminuer (2-5) : Plus sensible, capture les petits mouvements. Plus de signaux.
Nombre maximum de zones visibles (Par défaut : 6)
- ↑ Augmenter (10-20) : Plus de niveaux historiques visibles. Pour une analyse approfondie.
- ↓ Diminuer (2-4) : Seulement les niveaux récents. Graphique épuré.
Limite historique des pivots (Par défaut : 200)
- ↑ Augmenter (300-500) : Plus d'historique pour les calculs. Analyse à long terme.
- ↓ Diminuer (50-150) : Seulement la structure récente. Meilleure performance.
Nombre de projections actives (Par défaut : 5)
- ↑ Augmenter (5-10) : Plus de lignes de tendance projetées.
- ↓ Diminuer (1-2) : Seulement les tendances dominantes. Plus de clarté.
Afficher les lignes de tendance étendues (Oui/Non)
- Activé : Projette les tendances dans le futur.
- Désactivé : Seulement le zigzag historique.
🎯 Configurations rapides
- Scalping : Retour en arrière 15-20 | Déviation 3-5 | Zones 3-4
- Day Trading : Retour en arrière 25-35 | Déviation 6-8 | Zones 5-6
- Swing Trading : Retour en arrière 40-60 | Déviation 10-15 | Zones 8-12
Résumé
Avis clients
5 | 0 % | |
4 | 100 % | |
3 | 0 % | |
2 | 0 % | |
1 | 0 % |


