
CCI - With Arrows and 40 80 EMA Logic_noSourceCode
مؤشر
2 عمليات الشراء
الإصدار 1.0، Feb 2025
Windows, Mac
5.0
التقييمات: 1
الوصف
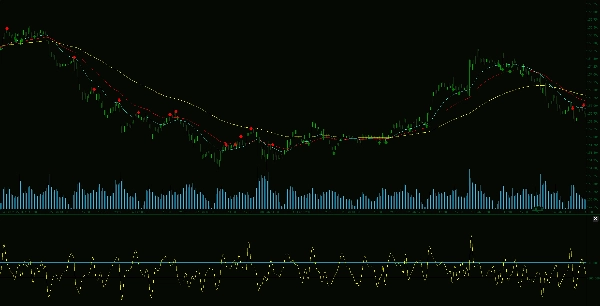
يعد مؤشر CCI و EMA المتقدم أداة تداول قوية تعزز تحليل الاتجاه من خلال دمج مؤشر قناة السلع (CCI) مع منطق EMA 40 و 80. تولد هذه الطريقة المتطورة أسهمًا تشير إلى حركة السعر المحتملة، مما يساعد المتداولين على تحديد فرص تداول ذات احتمالية عالية.
الميزات الرئيسية:
الملخص
ملخص الذكاء الاصطناعي
The Advanced CCI & EMA Indicator integrates the Commodity Channel Index (CCI) with 40 and 80-period Exponential Moving Averages (EMAs) to enhance trend analysis and momentum detection. It generates clear buy and sell arrows on the chart, signaling potential price movements based on combined momentum and trend confirmation. Key features include CCI-based identification of overbought and oversold conditions, EMA logic to confirm trend direction and filter weak signals, and customizable settings to adapt to various trading strategies and timeframes. This indicator supports traders in aligning with prevailing market trends and improving timing by reducing false reversal signals. It is suitable for use on indices and commodities markets.
ملف تعريف المؤشر
تقييمات العملاء
5.0
التقييمات: 1
5 | 100 % | |
4 | 0 % | |
3 | 0 % | |
2 | 0 % | |
1 | 0 % |
تقييمات العملاء
February 25, 2025
half size is enough at the start. Low quality setups lose some appeal.
مناقشة
الأسئلة الشائعة
Indices
Commodities
يتم توفير المنتجات المتاحة من خلال cTrader Store، بما في ذلك روبوتات التداول والمؤشرات والإضافات، من قبل مطوري الطرف الثالث وإتاحتها لأغراض الوصول المعلوماتي والفني فقط. cTrader Store ليس وسيطًا ولا يقدم نصائح استثمارية أو توصيات شخصية أو أي ضمان للأداء المستقبلي.


السعر
منذ 14/01/2025
55
المبيعات
11.44K
التثبيتات المجانية