
Description
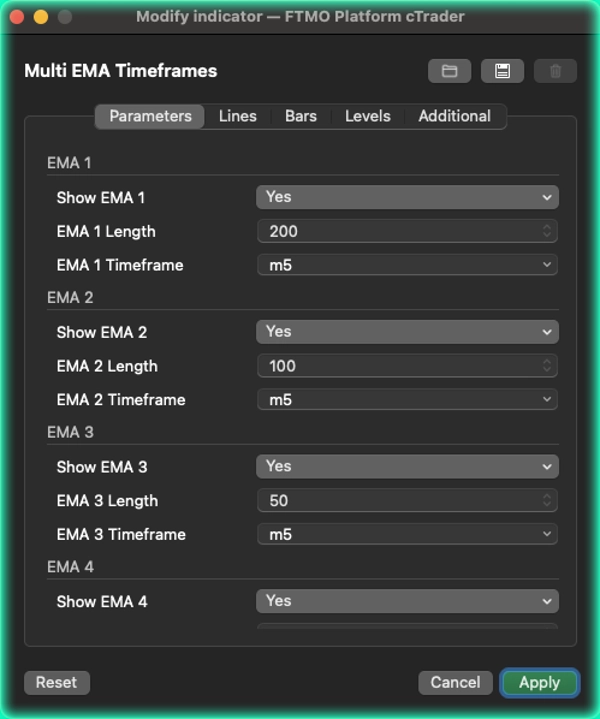
Multi EMA Timeframes by [BeyondTrading] L'erreur la plus courante que font les traders avec les moyennes mobiles est de changer de période simplement pour vérifier où se trouve une EMA clé. Multi EMA Timeframes élimine cela complètement. Vous restez sur votre période de travail — votre 5 minutes, votre 15 minutes, votre 1 heure — et vous définissez exactement quelle EMA de quelle période doit apparaître sur votre graphique, immédiatement, sans bouger.
Vous êtes sur le graphique 5 minutes et souhaitez voir l'EMA 200 de l'heure ? Fait. Vous voulez aussi l'EMA 50 du 15 minutes et l'EMA 20 de la période actuelle côte à côte ? Aussi fait. Chacune des cinq EMAs est configurée complètement indépendamment : sa propre période, sa propre période source, sa propre couleur, et son propre bouton marche/arrêt.
Ceci est particulièrement puissant pour les configurations de confluence. Lorsque le prix sur votre période d'entrée approche une EMA qui appartient à une période beaucoup plus élevée, ce niveau porte un poids structurel réel. Le voir directement sur votre graphique — sans changer d'onglet, sans douter de la valeur exacte — change la façon dont vous interagissez avec ces zones clés.
Deux modes de rendu vous permettent de contrôler la façon dont les lignes sont tracées. Le mode étape fige chaque EMA à la dernière barre source entièrement clôturée, donc la valeur ne change jamais jusqu'à la clôture de la barre de la période supérieure — zéro repeinture, totalement fiable pour les décisions de trading en direct. Le mode lisse interpole continuellement entre les barres source pour un visuel plus propre, mieux adapté à l'analyse et à la revue.
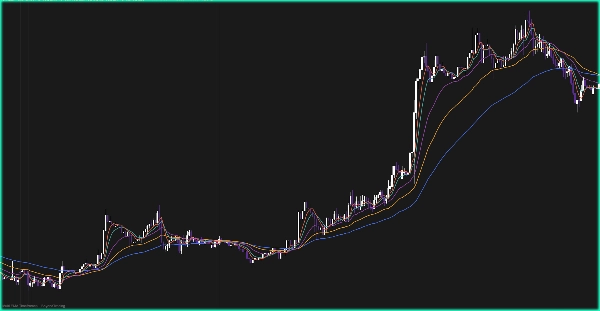
Ce qui le rend différent La plupart des indicateurs multi-EMA calculent tout sur la période actuelle du graphique. Ici, chaque EMA est réellement issue de sa propre période indépendante. Vous n'approximez pas — vous lisez la vraie EMA que les traders sur cette période voient réellement.
Fonctionnalités
- Jusqu'à 5 EMAs entièrement indépendantes, chacune avec sa propre période et sa propre durée
- Restez sur n'importe quelle période de graphique tout en lisant les EMAs de n'importe quelle autre période
- Mode étape : valeurs verrouillées aux barres source clôturées, pas de repeinture
- Mode lisse : interpolation linéaire pour des transitions visuelles fluides
- Bouton d'affichage/caché par EMA pour garder votre graphique propre en tout temps
Résumé
Avis clients
5 | 50 % | |
4 | 50 % | |
3 | 0 % | |
2 | 0 % | |
1 | 0 % |


![Logo de "[Hamster-Coder] Moving Average MTF"](https://cdn.ctrader.com/image/webp/b11b98b1-194d-4b8e-b00e-d611826ad159_31226)


