
FBX VWAP
Indicateur
2 achats
Version 1.0, Sep 2025
Windows, Mac
4.6
Avis : 3
Description
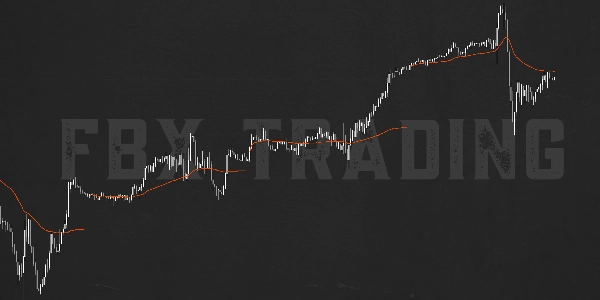
FBX VWAP Ancré — VWAP professionnel pour cTrader
VWAP de qualité institutionnelle, conçu selon vos besoins.
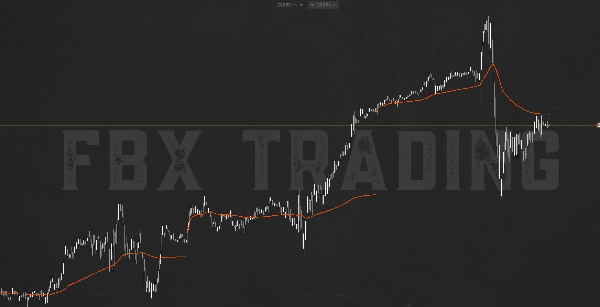
Une ligne segmentée qui redémarre au début de chaque jour, semaine ou mois, s’adapte automatiquement à la période et au symbole, et reste stable (sans « courir » après le prix) — exactement comme les professionnels utilisent le VWAP.
Pourquoi choisir ce VWAP ?
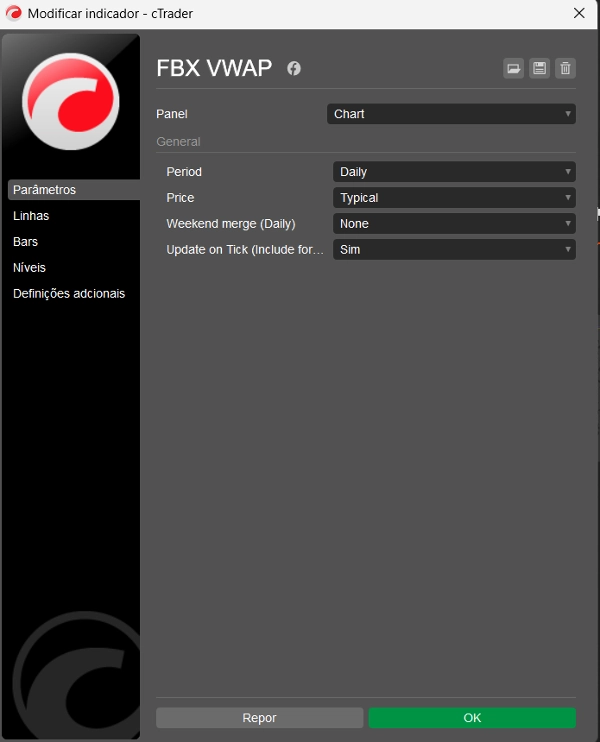
- Ancrages intelligents : sélectionnez Journalier / Hebdomadaire / Mensuel et le VWAP se réinitialise sur la première barre de chaque période — aucun ajustement de fuseau horaire nécessaire.
- Dessin propre et fidèle : discontinu entre les périodes (ne ressemble pas à une moyenne mobile), conforme aux configurations institutionnelles.
- Comportement stable : par défaut, il exclut la barre en formation, évitant les tiraillements artificiels vers le prix actuel.
- Mise à jour en temps réel (optionnelle) : activez Mise à jour au Tick si vous souhaitez que le VWAP « respire » en temps réel.
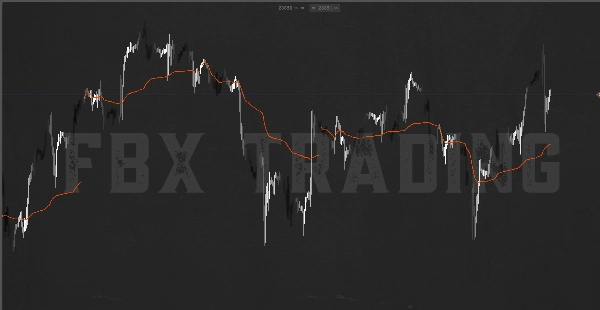
- Fonctionne sur toutes les périodes : de M1 à D1 (et plus) ; changez de symboles/périodes sans aucune reconfiguration.
- Base de prix configurable : Typique (par défaut), Clôture, Ouverture, Haut/Bas, Médian ou Pondéré.
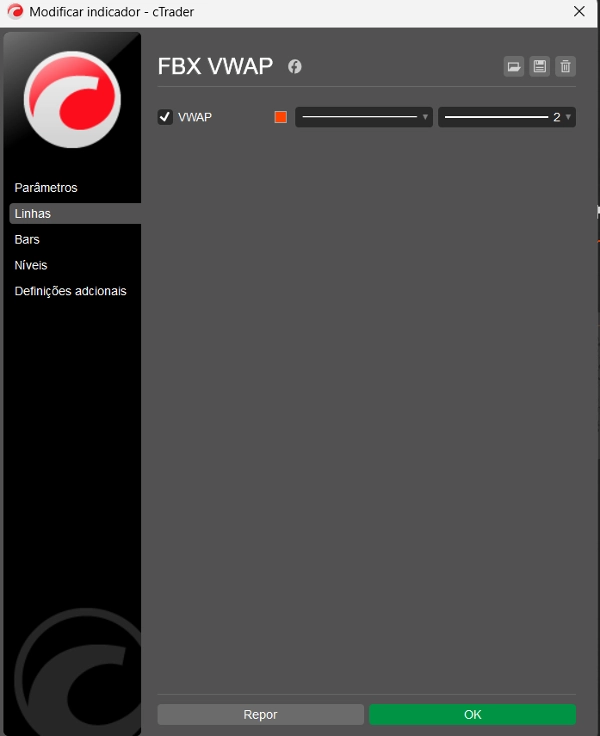
- Style natif cTrader : par défaut OrangeRed avec contrôle total sur la couleur, l’épaisseur et le style de ligne dans l’onglet Couleurs.
- Fusion du weekend (optionnelle) : en mode Journalier, fusionnez Vendredi→Lundi pour des flux 24×5 (Forex/CFD).
- Pas de repaint sur les barres fermées : mathématiques cumulatives classiques (∑P×V / ∑V) ; l’historique reste cohérent.
Avantages pour le trading
- Lecture objective de la valeur : utilisez le VWAP comme « prix équitable » de la période pour cartographier la tendance, les replis, et les zones de valeur.
- Gestion claire des risques : basez vos entrées sur les touches/rejets du VWAP de la période, selon votre plan.
- Flux multi-périodes : effectuez une analyse descendante (D → H1 → M5/M1) avec une logique d’ancrage cohérente.
Pour qui
Scalpers, day traders et swing traders cherchant un VWAP fidèle, propre et fiable prêt pour les routines professionnelles sur cTrader.
Caractéristiques clés (résumé)
- Ancrages : J / S / M
- Ligne segmentée entre les périodes
- Pas d’intrabar (par défaut) + optionnel Mise à jour au Tick
- Base de prix configurable
- Optionnel Fusion du weekend (Journalier)
- Personnalisation couleur/épaisseur/style
- Faible charge et compatible avec tout symbole/période
Résumé
Résumé IA
FBX VWAP Anchored is a professional Volume Weighted Average Price (VWAP) indicator designed for the cTrader platform. It provides an institutional-grade VWAP that resets at the start of each day, week, or month, adapting automatically to the selected timeframe and trading symbol. The indicator features segmented lines that are discontinuous between periods, reflecting a clean and stable representation without chasing current price movements.
Key functionalities include smart anchoring options (Daily, Weekly, Monthly) with no need for timezone adjustments, exclusion of the forming bar by default to maintain stability, and an optional live update mode that refreshes VWAP values on each tick. It supports any timeframe from 1 minute to daily and above, with configurable price bases such as Typical, Close, Open, High/Low, Median, or Weighted prices. Users can customize color, thickness, and line style using native cTrader styling options.
Additional features include an optional weekend merge for daily mode to accommodate 24x5 trading flows, no repainting on closed bars ensuring consistent historical data, and low computational overhead. The indicator is suitable for scalpers, day traders, and swing traders seeking a reliable VWAP tool for trend analysis, pullback identification, and risk management across various markets including Forex, indices, commodities, stocks, and cryptocurrencies.
Profil de l'indicateur
Avis clients
4.6
Avis : 3
5 | 67 % | |
4 | 33 % | |
3 | 0 % | |
2 | 0 % | |
1 | 0 % |
Avis clients
September 20, 2025
September 11, 2025
September 9, 2025
Pretty not bad as an extra filter, especially in active sessions. A manual check is still part of the process.
Discussion
Questions fréquentes
BTCUSD
Forex
Indices
EURUSD
Commodities
GBPUSD
NZDUSD
Prop
Crypto
Stocks
XAUUSD
NAS100
USDJPY
VWAP
Les produits disponibles sur cTrader Store, notamment les bots de trading, les indicateurs et les plug-ins, sont fournis par des développeurs tiers et mis à disposition à titre informatif et à des fins d'accès technique uniquement. cTrader Store n'est pas un courtier et ne fournit aucun conseil en investissement, aucune recommandation personnelle ni aucune garantie quant aux performances futures.
Plus de cet auteur


Prix
Depuis le 21/01/2025
2
Ventes
41
Installations gratuites