
IVB 2.0
Indicateur
1 achats
Version 1.0, Aug 2025
Windows, Mac
4.3
Avis : 3
Description
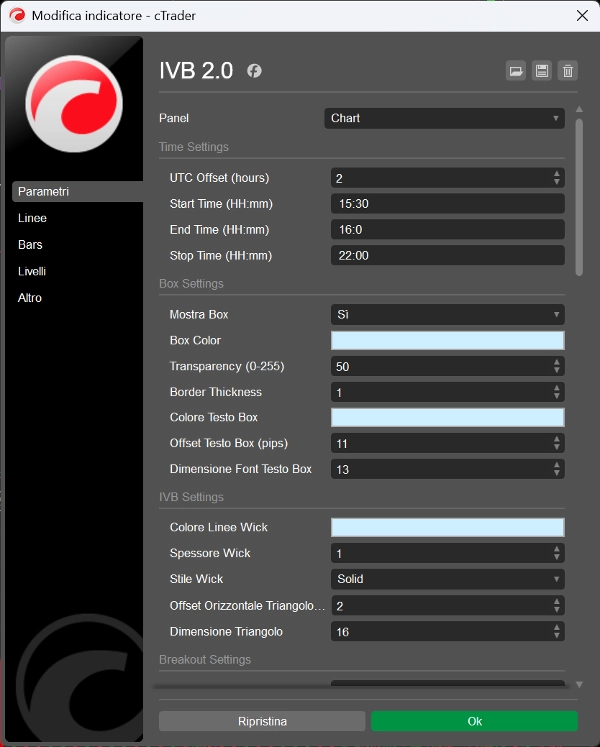
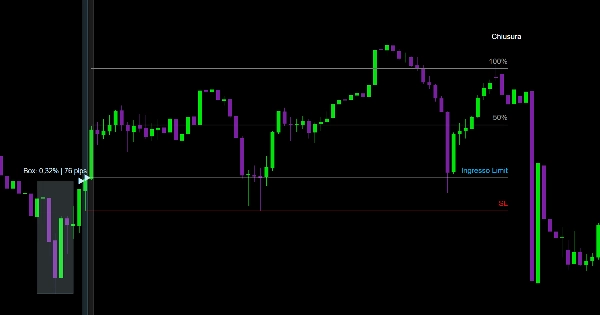
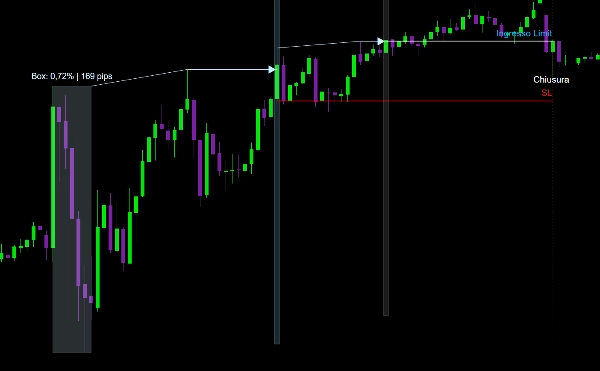
Une fois la plage temporelle pour créer la boîte de volatilité définie, l'indicateur signale les cassures, propose des points d'entrée (Limit ou Market), le placement du Stop Loss, et les niveaux de Take Profit aux projections de 50%/100%/200% une fois que cette boîte devient déséquilibrée, il est entièrement personnalisable : vous pouvez activer ou désactiver chaque fonctionnalité et ajuster les couleurs selon vos préférences.
Cet indicateur est conçu pour une unité de temps de 5 minutes.
Résumé
Résumé IA
IVB 2.0 is a trading indicator designed for use on a 5-minute timeframe, focusing on the imbalance within the maximum volatility box of indices. Users define a time range to create this volatility box, after which the indicator signals breakouts and suggests entry points using limit or market orders. It also provides guidance for placing Stop Loss and Take Profit levels at 50%, 100%, and 200% projections once the volatility box becomes imbalanced. The indicator is fully customizable, allowing users to enable or disable individual features and adjust color settings according to their preferences.
Profil de l'indicateur
Avis clients
4.3
Avis : 3
5 | 33 % | |
4 | 67 % | |
3 | 0 % | |
2 | 0 % | |
1 | 0 % |
Avis clients
September 14, 2025
September 11, 2025
the first 10 trades should stay boring. The review process gets less scattered.
August 31, 2025
Discussion
Questions fréquentes
Les produits disponibles sur cTrader Store, notamment les bots de trading, les indicateurs et les plug-ins, sont fournis par des développeurs tiers et mis à disposition à titre informatif et à des fins d'accès technique uniquement. cTrader Store n'est pas un courtier et ne fournit aucun conseil en investissement, aucune recommandation personnelle ni aucune garantie quant aux performances futures.


Prix
Depuis le 20/08/2025
1
Ventes