
Frac Support Resistance V1
Indicateur
2 achats
Version 1.0, Nov 2025
Windows, Mac
5.0
Avis : 1
Description
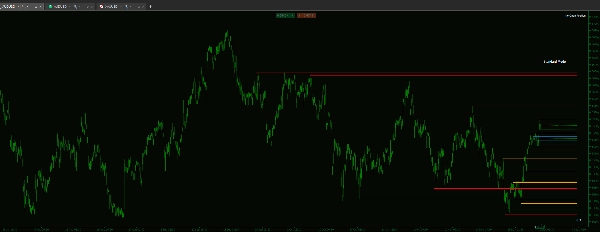
Si vous tradez en vous basant sur la structure du marché, vous savez que les niveaux les plus critiques sont souvent définis sur un cadre temporel supérieur. Cet indicateur personnalisé résout la frustration d'identifier et de suivre manuellement ces niveaux.
Cet outil est conçu pour fournir une hiérarchie visuelle fiable, vous permettant de voir les limites structurelles critiques et de prioriser les zones à forte valeur sans quitter votre écran d'exécution.
Fonctionnalités clés & contrôle granulaire
- L'indicateur est conçu pour une performance exceptionnelle et une visualisation claire du graphique :
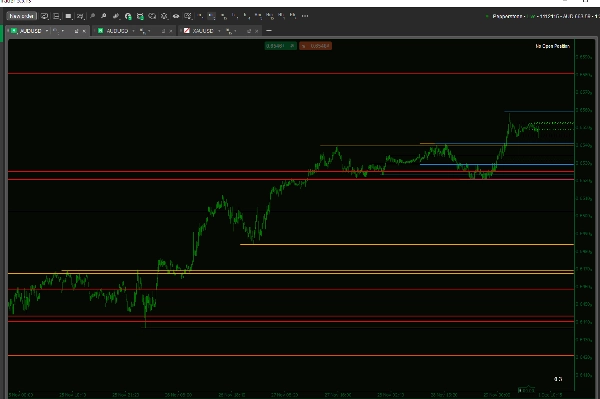
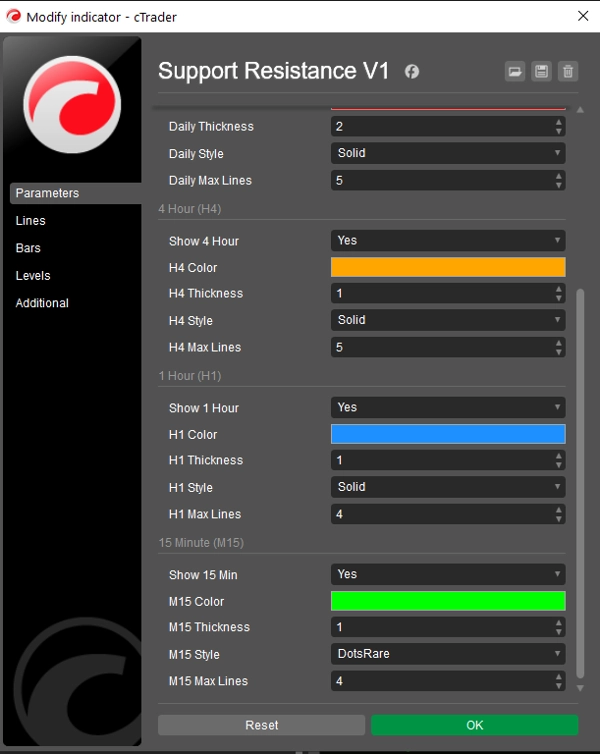
- Vraie hiérarchie visuelle : obtenez un contrôle indépendant sur l'épaisseur, le style de ligne (Solide, Tireté, Pointillé) et la couleur pour chaque cadre temporel.
- Avantage : reconnaissez immédiatement la force d'un niveau rien qu'à son apparence (par exemple, définissez les lignes D1 en Épaisse/Solide pour la structure majeure et les lignes H1 en Fine/Pointillée pour les niveaux immédiats).
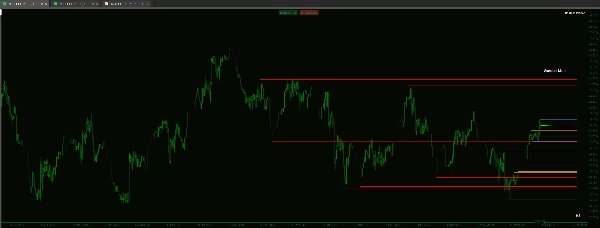
- Contrôle de performance & de concentration : marre des graphiques encombrés ? Vous pouvez limiter le nombre maximal de lignes affichées pour chaque cadre temporel individuellement.
- Exemple : définissez le nombre maximal de lignes H4 à 5 et D1 à 15 pour prioriser les niveaux récents sur les cadres temporels inférieurs tout en conservant une vue plus approfondie des structures majeures.
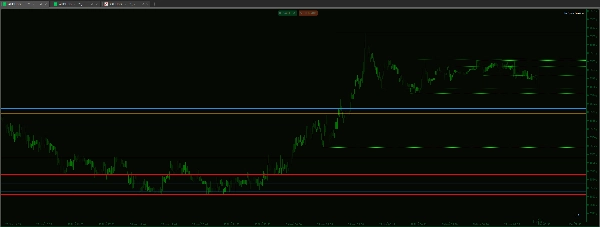
- Base de code propre : construit sur une logique fractale fiable, garantissant que les niveaux identifiés sont de véritables pivots hauts/bas utilisés dans l'analyse structurelle standard.
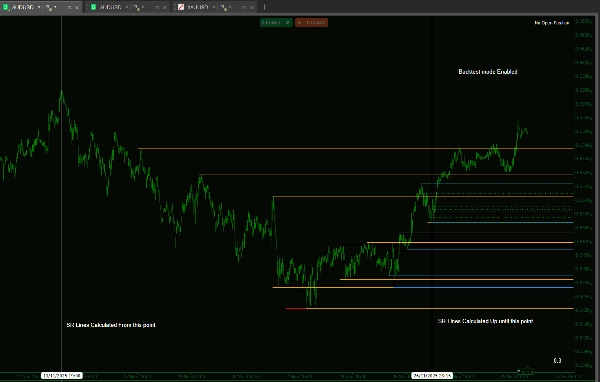
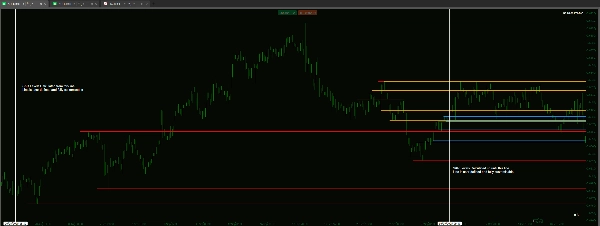
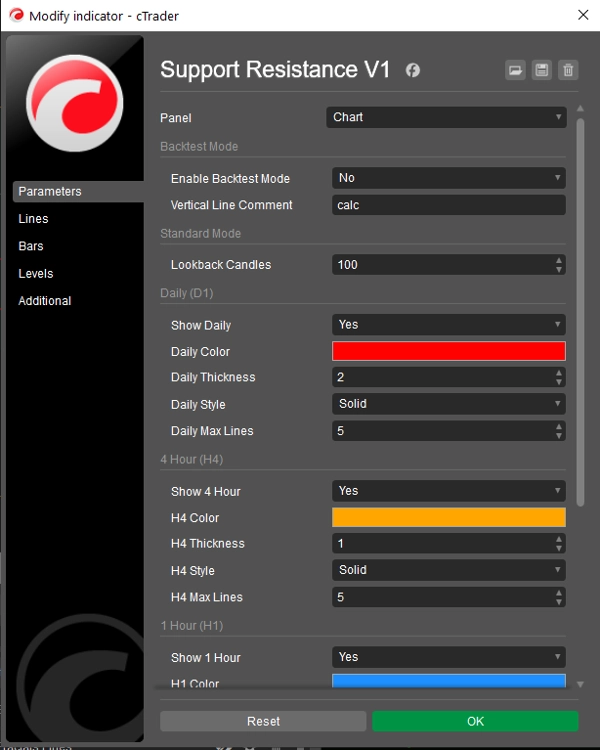
- Mode de backtesting dédié : inclut une fonction pour limiter l'analyse de l'indicateur à une plage temporelle spécifique et définie sur le graphique. Ceci est essentiel pour un backtesting manuel précis en simulant la progression du temps sans biais futur.
Résumé
Résumé IA
Frac Support Resistance V1 is a technical indicator designed to automatically calculate and display smart support and resistance lines derived from multiple timeframes: daily (D1), 4-hour (H4), hourly (H1), and 15-minute (M15). It assists traders who rely on market structure by visually highlighting critical price levels established on higher timeframes, reducing the need for manual identification.
Key features include customizable visual hierarchy, allowing independent adjustment of line thickness, style (solid, dashed, dotted), and color for each timeframe. This enables quick recognition of the relative strength of support and resistance levels. Users can also control chart clarity by setting maximum numbers of lines per timeframe to prioritize recent or major structural levels.
The indicator is based on fractal logic to identify genuine high and low pivots consistent with standard market structure analysis. It includes a dedicated backtesting mode that restricts analysis to a specified historical period, facilitating unbiased manual strategy testing by simulating real-time progression.
Frac Support Resistance V1 supports various markets including Forex, cryptocurrencies, commodities, indices, and stocks, with tags indicating compatibility with symbols like BTCUSD, EURUSD, GBPUSD, XAUUSD, NAS100, and USDJPY. The tool is suited for strategies involving breakout, scalping, smart money concepts, and grid trading.
Profil de l'indicateur
Avis clients
5.0
Avis : 1
5 | 100 % | |
4 | 0 % | |
3 | 0 % | |
2 | 0 % | |
1 | 0 % |
Avis clients
December 1, 2025
A small account test feels safer, and the plan becomes easier to stick with, and the chart still needs a final look.
Discussion
Questions fréquentes
BTCUSD
Forex
Signal
Breakout
Indices
EURUSD
Commodities
GBPUSD
NZDUSD
Prop
Scalping
SMC
Crypto
Grid
Stocks
AI
XAUUSD
NAS100
USDJPY
Les produits disponibles sur cTrader Store, notamment les bots de trading, les indicateurs et les plug-ins, sont fournis par des développeurs tiers et mis à disposition à titre informatif et à des fins d'accès technique uniquement. cTrader Store n'est pas un courtier et ne fournit aucun conseil en investissement, aucune recommandation personnelle ni aucune garantie quant aux performances futures.


Prix
Depuis le 14/01/2025
55
Ventes
11.31K
Installations gratuites