
Description
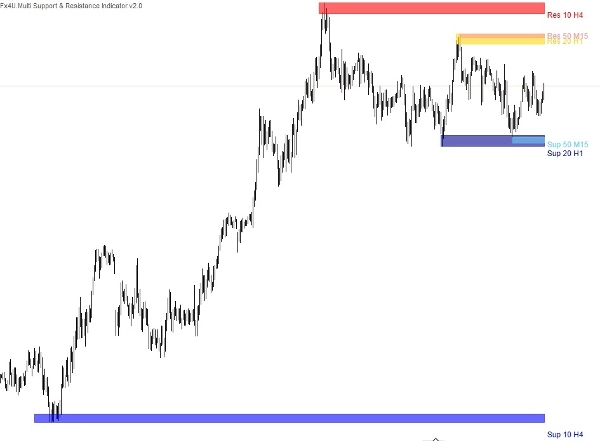
Les indicateurs de support et de résistance multi-échelles permettent généralement aux traders de visualiser ces niveaux sur différentes périodes, telles que les graphiques horaires, journaliers, hebdomadaires ou mensuels. En intégrant plusieurs périodes, les traders peuvent obtenir une perspective plus large sur l'emplacement des niveaux clés de prix et sur la manière dont ils peuvent influencer l'action des prix.
Ce type d'indicateur peut aider les traders à prendre des décisions de trading plus éclairées en identifiant des niveaux significatifs de support et de résistance susceptibles d'impacter les mouvements de prix sur différentes périodes. Il peut également aider les traders à anticiper des retournements potentiels ou des opportunités de cassure lorsque le prix approche ces niveaux sur plusieurs périodes.
Il existe trois types de niveaux de support & résistance :
Les trois indicateurs de support et de résistance sont intégrés dans cet indicateur unique vous permettant de tracer vos zones d'offre et de demande sur le graphique avec les réglages suivants.
- Valeur de la période.
- Période.
- Le nombre d'extrêmes – C'est le nombre de points de support/résistance actuels + passés affichés. Par exemple, si nous choisissons 2, l'indicateur sélectionnera un autre point de support et de résistance dans le passé.
- Nom et couleur de l'indicateur.
Les niveaux de support et de résistance significatifs sur des périodes plus longues ont tendance à avoir plus de poids et en utilisant un indicateur multi-périodes, les traders peuvent confirmer l'importance d'un niveau s'il apparaît de manière cohérente sur plusieurs périodes. Cette confirmation augmente la fiabilité du niveau et renforce la confiance des traders dans leurs décisions de trading.
Mes autres produits :
https://ctrader.com/products/346
https://ctrader.com/products/336
https://ctrader.com/products/343
https://ctrader.com/products/347
https://ctrader.com/products/147
Résumé
The indicator consolidates three types of support and resistance levels into a single tool, allowing users to plot supply and demand zones with customizable settings such as period value, timeframe, the number of extremum points (current plus past support/resistance points), and indicator name and color. This multi-timeframe approach helps traders identify levels that carry more weight when confirmed across different timeframes, enhancing the reliability of these levels for decision-making.
By visualizing these critical zones, the indicator aids in anticipating potential price reversals or breakout opportunities. It supports a broader market overview, enabling more informed trading strategies based on the interaction of price with established support and resistance across various time horizons.
Avis clients
5 | 33 % | |
4 | 67 % | |
3 | 0 % | |
2 | 0 % | |
1 | 0 % |
![Logo de "[Fx4U] GBPUSD - Price Action"](https://cdn.ctrader.com/image/webp/d80b34fc-da3c-4f01-a321-456450665649_26190)

![Logo de "[Fx4U] CADJPY - Price Action"](https://cdn.ctrader.com/image/webp/1ba81247-b6b7-4f3c-a297-fa3eb1d57fe1_26195)

![Logo de "[Fx4U] AUDCHF - Price Action"](https://cdn.ctrader.com/image/webp/0a22e9aa-c83b-42cd-b0b8-c1a2da593207_26148)

![Logo de "[Fx4U] EURAUD - Price Action"](https://cdn.ctrader.com/image/webp/baf8dde4-1ef3-4beb-8ae2-0fed8320f65d_26177)


