
ADXMultiframeIndicator
مؤشر
1 عمليات الشراء
الإصدار 1.0، Oct 2025
Windows, Mac
5.0
التقييمات: 2
الوصف
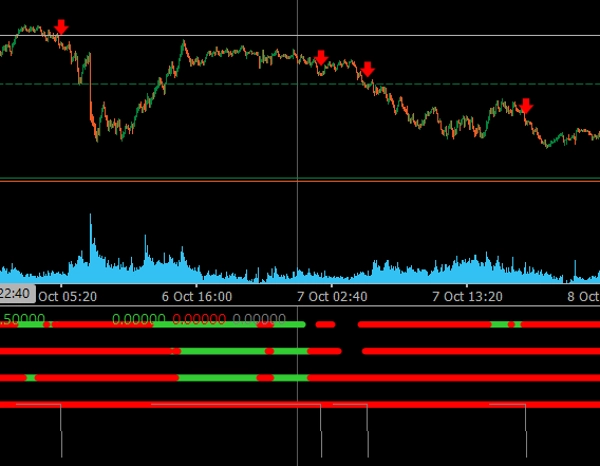
النقاط وأسهم اتجاه ADX متعددة الأطر الزمنية هو مؤشر تداول احترافي لـ cTrader، مصمم لتحديد الاتجاهات السوقية المتوافقة عبر أطر زمنية متعددة باستخدام مؤشر متوسط الحركة الاتجاهية (ADX).
🔹 الميزات الرئيسية:
- ✅ تحليل حتى 4 أطر زمنية قابلة للتخصيص (M15، H1، H4، يومي).
- ✅ النقاط الملونة تظهر الانحياز الاتجاهي (أخضر = اتجاه صاعد، أحمر = اتجاه هابط).
- ✅ تظهر الأسهم تلقائيًا عندما تتوافق جميع الأطر الزمنية في نفس الاتجاه.
- ✅ مرشح الأشرطة المتتالية يقلل من الإشارات الخاطئة أو المبكرة.
- ✅ تصور نظيف وحديث محسّن لكل من سمات المخطط الداكن والفاتح.
- ✅ مثالي لاكتشاف تأكيدات متعددة الأطر الزمنية ونقاط استمرار الاتجاه.
هذا المؤشر مثالي للمتداولين الذين يرغبون في رؤية الصورة الأكبر والدخول فقط عندما تتفق جميع الأطر الزمنية، مما يوفر إعدادات تداول أقوى وأكثر موثوقية.
الملخص
ملخص الذكاء الاصطناعي
The ADXMultiframeIndicator is a trading indicator for the cTrader platform that identifies market trends by analyzing the Average Directional Movement Index (ADX) across multiple timeframes. It supports up to four customizable timeframes, including M15, H1, H4, and Daily. The indicator displays colored dots to indicate directional bias—green for uptrends and red for downtrends—and automatically shows arrows when all selected timeframes align in the same direction. A consecutive bars filter is included to reduce false or premature signals. The visualization is designed to be clear and modern, compatible with both dark and light chart themes. This tool assists traders in confirming multi-timeframe trends and identifying trend continuation points by highlighting when all timeframes agree, facilitating more informed trade entries. It is particularly useful for analyzing indices markets.
ملف تعريف المؤشر
تقييمات العملاء
5.0
التقييمات: 2
5 | 100 % | |
4 | 0 % | |
3 | 0 % | |
2 | 0 % | |
1 | 0 % |
تقييمات العملاء
October 28, 2025
the first signal should not decide the only input, but it can look better than it is during a lucky run.
مناقشة
الأسئلة الشائعة
Indices
يتم توفير المنتجات المتاحة من خلال cTrader Store، بما في ذلك روبوتات التداول والمؤشرات والإضافات، من قبل مطوري الطرف الثالث وإتاحتها لأغراض الوصول المعلوماتي والفني فقط. cTrader Store ليس وسيطًا ولا يقدم نصائح استثمارية أو توصيات شخصية أو أي ضمان للأداء المستقبلي.
المزيد من هذا المؤلف


السعر
منذ 21/01/2025
3
المبيعات