
RsiMultiFrameOBOS
مؤشر
الإصدار 1.0، Oct 2025
Windows, Mac
4.0
التقييمات: 1
الوصف
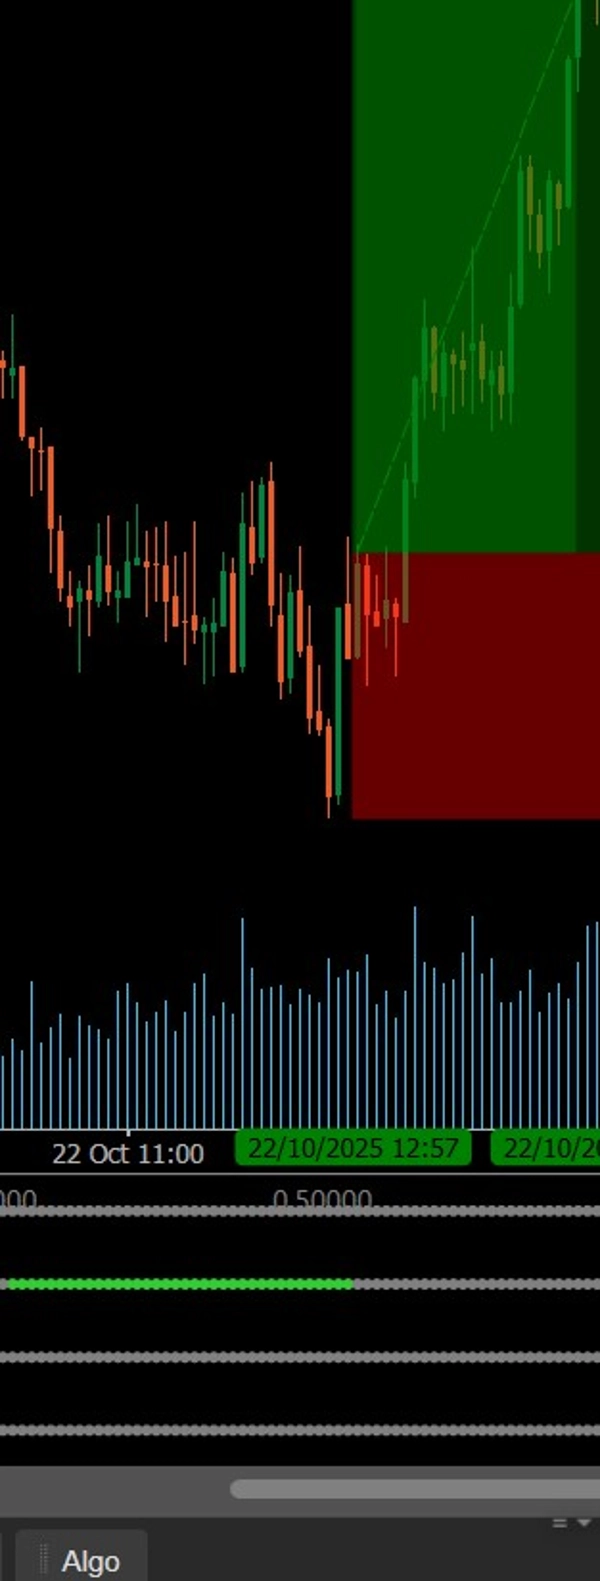
الوصف:
يعرض هذا المؤشر اتجاهات مؤشر القوة النسبية (RSI) عبر أربعة أطر زمنية قابلة للتخصيص باستخدام نقاط ملونة (الأخضر لمنطقة الشراء المفرط، الأحمر لمنطقة البيع المفرط، الرمادي للحالة المحايدة). يساعد المتداولين على تقييم توافق زخم السوق فورًا وتحديد تأكيدات مؤشر القوة النسبية عبر أطر زمنية متعددة لدخول أقوى.
الملخص
ملف تعريف المؤشر
تقييمات العملاء
4.0
التقييمات: 1
5 | 0 % | |
4 | 100 % | |
3 | 0 % | |
2 | 0 % | |
1 | 0 % |
تقييمات العملاء
November 8, 2025
A few signals across sessions tell more, and the review screen feels calmer.
مناقشة
الأسئلة الشائعة
BTCUSD
Prop
Forex
Scalping
Indices
EURUSD
Commodities
RSI
Crypto
Stocks
XAUUSD
Martingale
يتم توفير المنتجات المتاحة من خلال cTrader Store، بما في ذلك روبوتات التداول والمؤشرات والإضافات، من قبل مطوري الطرف الثالث وإتاحتها لأغراض الوصول المعلوماتي والفني فقط. cTrader Store ليس وسيطًا ولا يقدم نصائح استثمارية أو توصيات شخصية أو أي ضمان للأداء المستقبلي.
المزيد من هذا المؤلف


![شعار "[Hamster-Coder] Pivot Points MTF"](https://cdn.ctrader.com/image/webp/4c143e5a-309c-40e3-a578-f04d1e133ffa_31159)


![شعار "High-Low Divergence [Iridio Capital]"](https://cdn.ctrader.com/image/webp/443c4661-7abb-40f1-842f-4b6ec560649b_40914)


السعر
منذ 21/01/2025
3
المبيعات