شعار "Supply&Demand"
مؤشر
3 عمليات الشراء
الإصدار 1.0، May 2025
Windows, Mac
4.7
التقييمات: 4
صورة "Supply&Demand" المحملة
منذ 22/11/2024
119
المبيعات
2.49K
التثبيتات المجانية

⚡ الميزات الرئيسية

  • كشف المنطقة الديناميكية
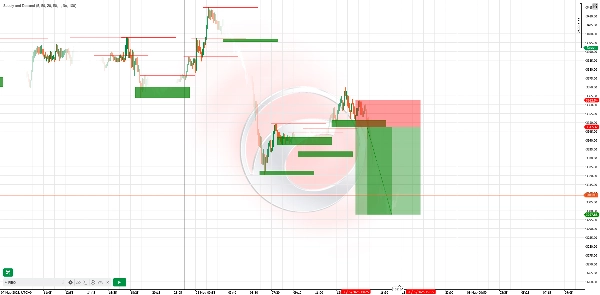
    • يكشف تلقائيًا عن قمم/قيعان التأرجح ويرسم مناطق العرض (المقاومة) والطلب (الدعم) في الوقت الحقيقي.
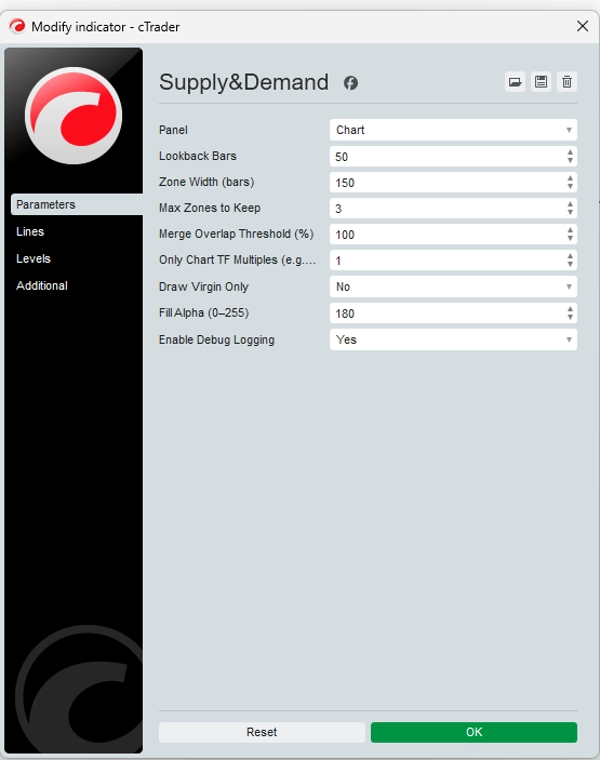
    • تسمح معلمات الرجوع وعرض المنطقة القابلة للتكوين بضبط الحساسية لأي سوق أو إطار زمني.
  • تسليط الضوء على المنطقة البكر
    • تُبرز المناطق "البكر" الجديدة (التي لم يلمسها السعر من قبل) بصريًا—تداول حيث تركت المؤسسات أوامرها.
    • اختر إخفاء المناطق التي تم لمسها للحفاظ على نظافة الرسم البياني.
  • تصفية متعددة الأطر الزمنية
    • ارسم فقط المناطق التي تتوافق مع مضاعف الإطار الزمني للرسم البياني الخاص بك (مثلاً عرض المناطق اليومية على الرسم البياني للساعة).
    • شاهد بسرعة التقاء العرض/الطلب في الإطار الزمني الأعلى مع إعدادك داخل اليوم.
  • غير معاد الرسم وغير متأخر
    • المناطق ثابتة بمجرد رسمها—لا خطوط تختفي أو تتحرك بعد تحرك السعر.
    • موثوقية مختبرة رجعيًا: تبقى المناطق ثابتة، مما يمنحك الثقة في التحليل التاريخي.
  • تنبيهات مخصصة وتسجيل
    • احصل على تنبيهات منبثقة أو عبر البريد الإلكتروني عند دخول السعر أو كسره لمنطقة.
    • سجل تصحيح مفصل يظهر إنشاء المنطقة، وتخطي التداخلات، ولمسات المنطقة.


🚀 كيف يعمل

  1. كشف المحاور: يفحص المؤشر كل شريط جديد للقمم المحورية (العرض) والقيعان المحورية (الطلب) بناءً على الرجوع الذي اخترته.
  2. بناء المنطقة: لكل محور، يتم رسم منطقة مستطيلة تمتد للأمام—مُبرزة حيث من المحتمل أن تكون المؤسسات قد وضعت أوامر الحد.
  3. تصفية التداخل: المناطق التي تتداخل بما يتجاوز الحد الخاص بك تندمج أو تُتخطى، مما يضمن بقاء المناطق الأكثر أهمية فقط.
  4. خيار المناطق البكر فقط: احتفظ فقط بالمناطق التي لم تُلمس للتركيز على أحدث المستويات المؤسسية.


🎯 أمثلة على استراتيجيات التداول

الاستراتيجيةالإطار الزمنيالدخولوقف الخسارةجني الأرباح

رفض المنطقة

H1

انتظر حتى يرتفع السعر إلى منطقة الطلب ويظهر شمعة هبوطية (ابتلاع/شمعة دبابيس) في منطقة العرض

فقط بعد حدود المنطقة

1.5× ارتفاع المنطقة

التقاء الأطر الزمنية

M15 + H4

حدد منطقة الطلب على H4، ثم انتقل إلى M15 لشمعة زخم صعودية داخل تلك المنطقة

أسفل أدنى منطقة H4

أعلى تأرجح H4 التالي

الاختراق وإعادة الاختبار

H4

بعد أن يخترق السعر منطقة العرض، انتظر لإعادة اختبار الجانب السفلي للمنطقة وتأكيد هبوطي

فوق قمة المنطقة

أدنى مستوى H4 حديث

نصيحة استخدام: اجمع مع تباعد RSI أو MACD داخل المناطق لإشارات ذات احتمالية أعلى.


📈 مثال من العالم الحقيقي

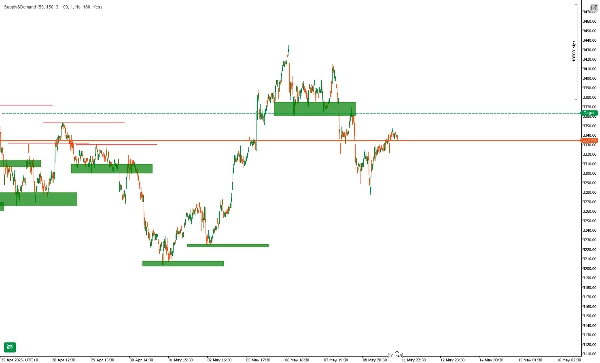
  1. على EURUSD H4، يرسم المؤشر منطقة طلب عند 1.0950–1.0980.
  2. ينخفض السعر إلى المنطقة، ويطبع شمعة ابتلاع صعودية M15.
  3. الدخول عند 1.0970، الوقف عند 1.0945 (أسفل المنطقة)، الهدف عند 1.1040 (المقاومة H4 التالية).
  4. النتيجة: +70 نقطة (~6.4× المخاطرة).


⚠️ إخلاء المسؤولية

هذا المؤشر هو أداة—ليس نظام ربح مضمون. الأداء السابق لا يضمن النتائج المستقبلية. استخدم دائمًا إدارة مخاطر مناسبة (مثل الحد الأقصى 2% لكل صفقة)، جرب على حساب تجريبي أولاً، وادمجه مع تحليلك الخاص. التداول يحمل مخاطر الخسارة؛ تداول فقط برأس المال الذي يمكنك تحمل خسارته.

ملف تعريف المؤشر
4.7
التقييمات: 4
5
75 %
4
25 %
3
0 %
2
0 %
1
0 %
تقييمات العملاء
November 9, 2025
A solid Supply & Demand tool - clear zones, stable performance, and visually neat. Great for spotting imbalances and retracement entries. Would love built-in alerts, but overall it’s a reliable companion for swing and intraday setups.
May 23, 2025
The main upside is low quality setups lose some appeal. It can look better than it is during a lucky run.
May 18, 2025
The first 10 trades should stay boring, and unclear signals stop looking so clean.
May 15, 2025
EURUSD
RSI
MACD
يتم توفير المنتجات المتاحة من خلال cTrader Store، بما في ذلك روبوتات التداول والمؤشرات والإضافات، من قبل مطوري الطرف الثالث وإتاحتها لأغراض الوصول المعلوماتي والفني فقط. cTrader Store ليس وسيطًا ولا يقدم نصائح استثمارية أو توصيات شخصية أو أي ضمان للأداء المستقبلي.

المزيد من هذا المؤلف

مؤشر
RSI
Forex
+4
Advanced RSI Indicator with multi-MA smoothing, Bollinger Bands, divergence detection, and fill zones for cTrader.
مؤشر
AI
ATR
+27
The Support & Resistance Pro helps traders identify key support and resistance levels for informed trading decisions.
cBot
FiboSmart cBot automates Fibonacci-based trading with trend, RSI, and MACD filters, plus built-in money management, trai
مؤشر
ATR
Forex
+3
LevelMaster S/R: Pinpoint key support & resistance zones with precision. Perfect for traders of all levels Trade smarter
مؤشر
RSI
MACD
Unlock market insights with our Multi-Timeframe Market Levels indicator, enhancing your trading strategies effortlessly
مؤشر
AI
SMC
+5
Complete ICT Killzones: 5 sessions, easy colors, transparency controls & session info. Professional timing for cTrader.
مؤشر
SmartFibonacci — automatic Fibonacci retracements & extensions with swing detection, alerts and clean labels for cTrader
مؤشر
ATR
RSI
+18
Institutional liquidity map for XAUUSD. Spot stop hunts, find the next target, and get a full trade setup automatically.
مؤشر
MACD
Forex
+5
🚀 MACD Pro Trader – Advanced MACD with buy/sell signals, custom MAs & color-coded histograms for smarter trading! 📈🔥
مؤشر
ATR
RSI
+5
Advanced Anchored VWAP for cTrader: volatility bands, real‑time alerts & customizable session resets.
مؤشر
RSI
XAUUSD
+2
Automatic ZigZag swings with dynamic support & resistance levels, labeling highs/lows for clear trend signals.
مؤشر
AI
ATR
+20
Detects smart money activity using advanced tick volume and price divergence analysis.

قد يعجبك أيضًا

مؤشر
Prop
Forex
+10
IBS Indicator – Measures price position within bars for smarter trades. Works on all markets & timeframes.
مؤشر
Order Block
Breaker Block
+1
Automatically detects bullish & bearish order blocks and breaker blocks with popup alerts and equilibrium levels.
مؤشر
VWAP
Volume
+5
The MA Quant Volume Profile Custom Range is a trading indicator that analyzes volume distribution across the price.
مؤشر
Prop
Scalping
Shows bars from different Time Frame on zoom out and hides the current bars. Perfect tool for Multi TF "Market Reply"
مؤشر
AI
RSI
+18
Session boxes with UTC offset, OR logic, adjustable opacity, and multi-day lookback.
مؤشر
Key Levels
Market Structure
Economic calendar news directly on the chart.
مؤشر
Forex
BTCUSD
+7
🚀 TMAX RBA Indicator - The Ultimate Multi-Timeframe Momentum System 🚀
مؤشر
ATR
Breakout
+1
A volatility-adaptive trend-following indicator that dynamically adjusts to market conditions.
مؤشر
Inducement
Key Levels
+5
Digital Clock Overlay that displays a live, second-by-second clock and optional date directly on the trading chart.
مؤشر
SMC
Prop
+4
📈 Trading Sessions Indicator — London, New York & Tokyo Visualize Key Market Sessions + High/Low Levels with Precision
مؤشر
ATR
VWAP
+4
Structure-aware indicator that re-anchors VWAP to confirmed swing pivots.
مؤشر
ATR
SMC
+2
HTF POWER 3 ICT Power of 3 · M1 Precision · H4 Intelligence Auto-detect Accumulation → Manipulation → Distribution
شعار "Two Candle Patterns "
4.5
(4)
$19
/
$35
مؤشر
Forex
Crypto
+3
Detect powerful 2-candle reversal patterns at key highs/lows. Boost entries with real-time alerts and visual signals.
مؤشر
Forex
Indices
+1
Detects HTF bias using CRT, Expansion & Swing Point patterns with SMT/PSP divergence — visualised in a floating candle
مؤشر
EURUSD
GBPUSD
+3
All-in-one suite for ICT concepts: NY Midnight Open, Killzones, automatic Liquidity levels (PDH/L, PWH/L).
مؤشر
EMA
RSI
+5
MACD Colour Histogram with 11 Moving Average Types, Multi-timeframe confirmation and Sound Signal Alert.
مؤشر
RSI
Prop
+12
🧠Visually marks momentum zones when the RSI crosses the overbought/oversold thresholds (default 70/30). ✅
مؤشر
AI
ATR
+12
Indicator that auto-calculates SL/TP via volatility. 3 layers: digital filtering, recursive Bayes, adaptive factor
منذ 22/11/2024
119
المبيعات
2.49K
التثبيتات المجانية