
IM_AngleIndicator
インジケーター
1 購入済
バージョン 2.0、Jul 2026
Windows、Mac
4.5
レビュー: 2
説明
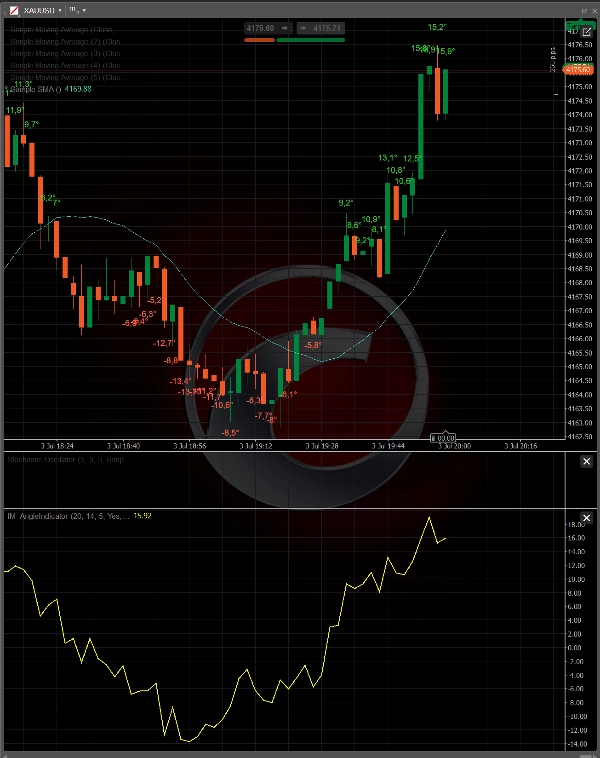
IM_AngleIndicator は単純移動平均の傾きを客観的で比較可能な角度の尺度に変換します。
ほとんどの「角度」インジケーターは生の価格変動から傾きを計算しますが、その結果は銘柄の絶対スケールや時間枠に依存します。そのため、同じ度数の値でも通貨クロス、指数、暗号通貨では全く異なる意味を持ちます。IM_AngleIndicator は ATRでSMAの変化を正規化することでこれを解決します:傾きは「バーあたりのATR」として表現され、次に度数に変換されます。こうして、45°の傾きは分析対象の銘柄や時間枠に関わらず常にバーあたり1ATRの動きを表します。結果として、一貫した読み取り値とポートフォリオ全体で再利用可能な閾値が得られます。
動作原理
- 選択された期間に基づき終値のSMAを計算します。
- 連続する2つのバー間の変化を測定し、ATRで割って正規化します。
- 得られた比率をアークタンジェントで度数に変換し、おおよそ−90°から+90°の値を返します。
- 専用パネルにオシレーターとして値をプロットし、傾きが設定された閾値を超えた場合、価格チャートの高値の上(強気トレンド)または安値の下(弱気トレンド)にラベルを追加します。
主な特徴
- ATR正規化により銘柄や時間枠に依存しない傾きの測定。
- 重要な動きをフィルタリングしノイズを除外するための度数で設定可能な閾値。
- 方向性を示す色分けラベル(上昇は緑、下降は赤)と、ローソク足に対して見やすい配置のためのATRベースの垂直オフセット。
- チャートオブジェクトの最適化処理:ラベルは最新のバーに限定され、長期間のチャートでもパフォーマンスを維持。
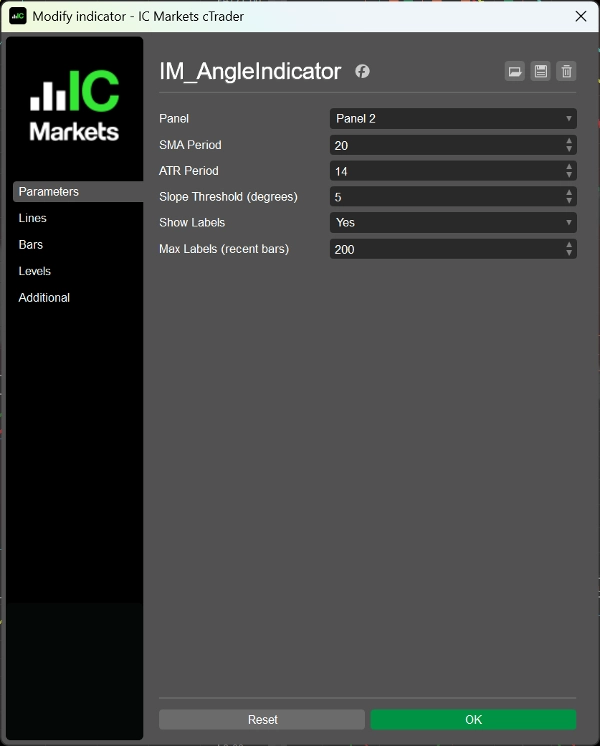
- 完全にカスタマイズ可能なパラメーター:SMA期間、ATR期間、傾き閾値、ラベル表示、ラベル最大数。
使用例
- 強いトレンド局面と横ばいレンジの識別。
- エントリーおよびエグジット戦略を支援する方向性の確認。
- 同じ閾値を使って複数銘柄のトレンド強度を比較。
- 正規化された傾きを取引シグナルとして使うcBots開発の基盤。
概要
インジケーターのプロフィール
インジケーターのカテゴリー
トレンド
出力の種類
ビジュアル表示
データ要件
バーのみ
サポート対象のシグナル
トレンドの強さ
カスタマーレビュー
4.5
レビュー: 2
5 | 50 % | |
4 | 50 % | |
3 | 0 % | |
2 | 0 % | |
1 | 0 % |
カスタマーレビュー
November 19, 2024
The setup needs a cleaner reason to exist, but sideways markets can fake the filter.
November 13, 2024
kinda useful when the chart is messy. It can look better than it is during a lucky run.
ディスカッション
よくあるご質問
Forex
Signal
EURUSD
Commodities
XAUUSD
cTrader Storeで入手可能な取引ボット、インジケーター、プラグインなどの商品は、第三者の開発者が提供するものであり、情報と技術の取得のみを目的としてご利用いただけます。cTrader Storeはブローカーではなく、投資助言や個人的な推奨を行うことも、将来のパフォーマンスを保証することもありません。
これも好きかも


![「High-Low Divergence [Iridio Capital]」ロゴ](https://cdn.ctrader.com/image/webp/443c4661-7abb-40f1-842f-4b6ec560649b_40914)


価格
登録日 11/11/2024
33.44M
取引数量
72.4K
獲得pips
1
販売