
DARK POLL SIGNAL_noSourceCode
مؤشر
1 عمليات الشراء
الإصدار 1.0، Mar 2025
Windows, Mac
5.0
التقييمات: 2
الوصف
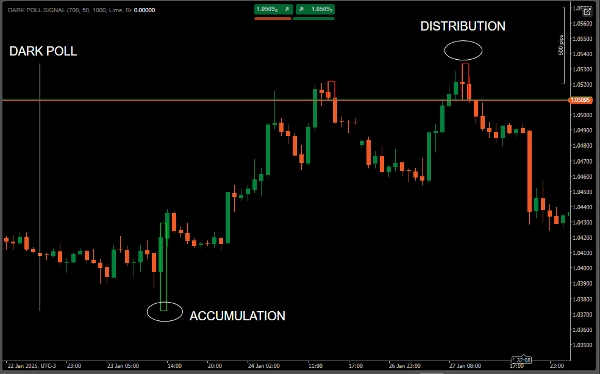
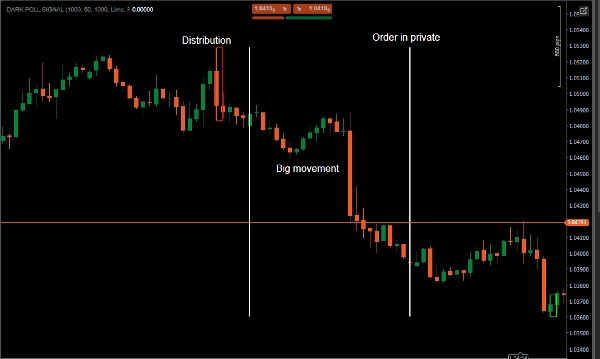
في إشارة تجمع التداول المظلم حيث تسبق التحركات الكبيرة، على وجه الخصوص، بعد التراكم يمكن أن يبدأ اتجاه صاعد. وبعد التوزيع اتجاه هابط.
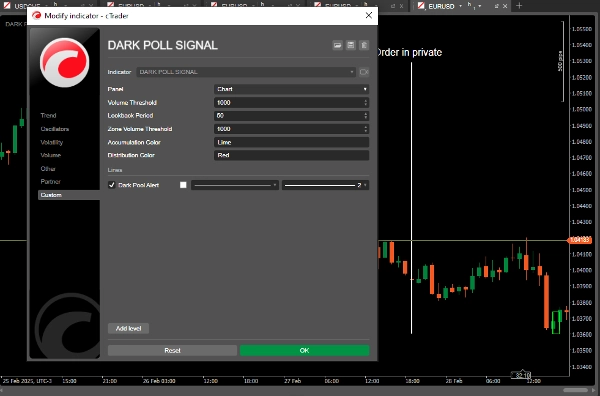
1-حجم تجمع التداول المظلم: إذا كان حجم التيك منخفضًا، يتم عرض مخطط بياني أبيض، وهو تسرب سيولة.
2-يقوم المؤشر بالتحقق من وجود حجم وتوحيد سعر كبير.
إذا تم الكشف عنه، يرسم مستطيلًا في المنطقة المقابلة.
الرسم:
تُبرز مناطق التراكم باللون الأخضر.
تُبرز مناطق التوزيع باللون الأحمر.
يتيح لك هذا المؤشر المدمج مراقبة نشاط تجمع التداول المظلم ومناطق التراكم/التوزيع في لوحة واحدة.
الملخص
ملخص الذكاء الاصطناعي
The DARK POLL SIGNAL indicator monitors Dark Pool volume and identifies key accumulation and distribution zones to anticipate significant market movements. It analyzes tick volume, displaying a white histogram to indicate liquidity leaks when volume is low. The indicator detects areas of significant volume and price consolidation, marking these zones with rectangles: green for accumulation and red for distribution. This visual representation helps users track potential upward trends following accumulation phases and downward trends after distribution phases. By combining Dark Pool activity with accumulation and distribution zone detection in a single panel, the indicator provides a consolidated view of market liquidity and price behavior.
ملف تعريف المؤشر
تقييمات العملاء
5.0
التقييمات: 2
5 | 100 % | |
4 | 0 % | |
3 | 0 % | |
2 | 0 % | |
1 | 0 % |
تقييمات العملاء
March 5, 2025
The logic holds up when the trade idea gets slowed down first, and two sessions say more than one clean chart.
مناقشة
الأسئلة الشائعة
Signal
يتم توفير المنتجات المتاحة من خلال cTrader Store، بما في ذلك روبوتات التداول والمؤشرات والإضافات، من قبل مطوري الطرف الثالث وإتاحتها لأغراض الوصول المعلوماتي والفني فقط. cTrader Store ليس وسيطًا ولا يقدم نصائح استثمارية أو توصيات شخصية أو أي ضمان للأداء المستقبلي.


السعر
116
المبيعات
9.31K
التثبيتات المجانية