
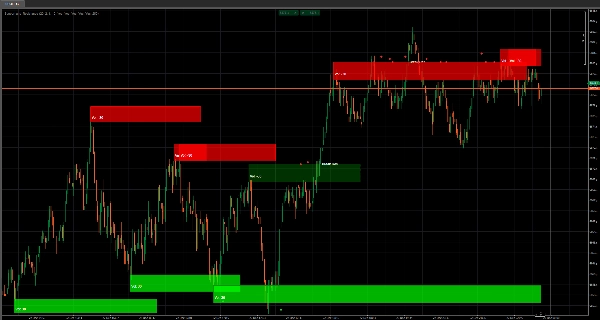
✅ صناديق الدعم والمقاومة ذات الحجم الكبير — ترسم تلقائيًا مناطق "الدفاع / الاختراق" الحقيقية
✅ قوة المنطقة المرجحة بالحجم (تعتيم ديناميكي) — حجم أكبر = وجود أقوى للصندوق
✅ إنشاء المنطقة بناءً على المحاور (النظر إلى الوراء) — فقط المستويات المؤكدة تصبح مناطق (ضوضاء أقل)
✅ عرض الصندوق التكيفي (مبني على ATR) — المناطق تتناسب مع التقلب الحالي، وليس تخمينات ثابتة
✅ تمديد الصندوق الحي — المناطق تستمر في الإسقاط للأمام مع تطور السعر
✅ ذكاء الاختراق / الثبات — يكتشف متى تثبت المنطقة مقابل متى تخترق ويتفاعل فورًا
✅ علامات الحدث البصرية (الألماس) — تأكيدات "الثبات / الانعكاس" النظيفة بدون تعقيد
✅ تسميات الاختراق — أحداث "اختراق الدعم / اختراق المقاومة" واضحة على الرسم البياني
✅ تحكم بصري كامل — مفاتيح تشغيل/إيقاف للصناديق / نص الحجم / الألماس / تسميات الاختراق
✅ نظام التنظيف التلقائي — يمنع ازدحام الرسم البياني بإزالة علامات الأحداث القديمة تلقائيًا
✅ الحد الأقصى للتحكم في الصناديق — حد صارم للحفاظ على سرعة الأداء وقابلية قراءة الرسوم البيانية
الدعم والمقاومة (صناديق الحجم الكبير) ليست أداة دعم/مقاومة أساسية ترسم خطوطًا عشوائية.
تم بناء هذا المؤشر ليُظهر لك شيئًا أكثر قيمة بكثير:
أين خلق السعر اهتمامًا حقيقيًا — وأين من المرجح أن يتفاعل مرة أخرى.
بدلاً من رسم "مستويات جميلة"، فإنه يبني مناطق العرض والطلب ذات الحجم الكبير كـ صناديق مباشرة على الرسم البياني الخاص بك، حتى تتمكن من التداول على الهيكل مثل المحترفين:
تحديد المنطقة → مراقبة التفاعل → التداول على الثبات أو الاختراق.
الميزة الأساسية: الحجم + الهيكل، لا التخمين
يتم إنشاء كل صندوق فقط عندما تتوافق شرطين:
- محور مؤكد (الهيكل مهم)
- ذروة حجم (الاهتمام مهم)
هذا يعني أنك لن تتلقى مناطق ضعيفة بشكل عشوائي.
تحصل على عدد أقل من المناطق — لكن المناطق التي تحصل عليها هي المناطق التي تهم فعلاً.
القوة التي يمكنك رؤيتها (التعتيم = القوة)
هنا يصبح الأمر غير عادل للأشخاص الذين يتداولون دعم/مقاومة "عمياء".
تعتيم ملء الصندوق يتناسب مع الحجم، لذا تعرف فورًا:
- صندوق خافت = اهتمام خفيف (راقبه)
- صندوق قوي = اهتمام كبير (احترمه)
لا مؤشرات إضافية، لا تمارين تفسير — إنه مرئي حرفيًا.
مناطق متكيفة مع التقلب (عرض ATR)
الأسواق لا تتحرك بنفس الطريقة كل يوم.
هذا المؤشر يتكيف مع سمك الصندوق باستخدام خط أساس ATR طويل، لذا تتوسع أو تضيق المناطق مع التقلب.
النتيجة:
المناطق تبقى واقعية بدلاً من أن تكون رقيقة جدًا لتهم أو واسعة جدًا لتكون عديمة الفائدة.
ذكاء الثبات مقابل الاختراق (وتغذية بصرية فورية)
المنطقة ذات قيمة فقط إذا كنت تستطيع قراءة ما يفعله السعر بها.
هذا المؤشر يتتبع:
- الثبات (الرفض / الاحترام)
- الاختراقات (القبول عبر المنطقة)
…ثم يحدث النمط بصريًا مباشرة:
- الثبات يحافظ على "هوية الدعم/المقاومة" الأصلية
- الاختراقات تقلب السلوك (يمكن أن يصبح الدعم مقاومة والعكس صحيح)
- يمكن أن يتحول نمط الاختراق إلى متقطع + لون جديد لتعرف فورًا:
"هذا المستوى تغير طابعه للتو."
الألماس + تسميات الاختراق: محفزات قرار نظيفة
تحصل على علامات أحداث بسيطة وعالية الإشارة:
- الألماس لتسليط الضوء على أحداث الثبات/الانعكاس
- تسميات الاختراق حتى لا تفوت لحظة انكسار المستوى
إنها الفرق بين التفكير بأن شيئًا ما قد انكسر… و المعرفة بأنه قد انكسر.
مصمم للتداول الحقيقي: التحكم + الرسوم البيانية النظيفة
تم تصميم هذا المؤشر ليظل قابلاً للاستخدام بعد ساعات من التداول:
- هل تريد المناطق فقط؟ أوقف تشغيل الألماس/التسميات.
- هل تريد إشارات نقية؟ أوقف تشغيل نص الحجم.
- هل تريد الأداء؟ حدد الحد الأقصى للصناديق.
- تكره الفوضى؟ تنظيف الأحداث التلقائي يحافظ على الرسم البياني واضحًا بإزالة العلامات القديمة تلقائيًا.
تظل مركزًا على المعركة الحالية — وليس غارقًا في التاريخ.
الإعداد الموصى به (بدء سريع)
✅ فترة النظر إلى الوراء: 20 (تأكيد متوازن)
✅ طول فلتر الحجم: 2 (استجابة)
✅ مضاعف عرض الصندوق: 1.0 (محايد)
✅ عرض الصناديق: تشغيل
✅ الألماس + تسميات الاختراق: تشغيل (حتى تتعلم السلوك، ثم قم بتحسينه)
✅ تنظيف الأحداث التلقائي: تشغيل (حافظ على النظافة)
ما يقدمه لك هذا المؤشر حقًا
خريطة بصرية لـ مكان كشف السوق عن نواياه — وقراءة مباشرة عما إذا كان السعر يحترم تلك المنطقة أو يدمرها.
إذا كنت تتداول الاختراقات، أو الارتدادات، أو الانعكاسات، أو إعادة الاختبار:
هذا يصبح "طبقة المعركة" الخاصة بك.


![شعار "[Hamster-Coder] Bollinger Bands"](https://cdn.ctrader.com/image/webp/21d8e5d6-fb11-4bac-b9ee-cd05c2b76804_30327)


