
说明
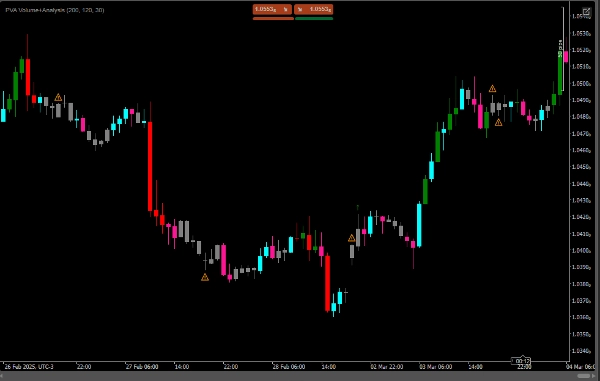
PVA(价格-成交量分析)是一种技术分析方法,研究金融资产的价格与交易量之间的关系。PVA的核心理念是,交易量可以提供有关趋势强度和方向的重要信息,帮助交易者做出更明智的决策。
- 价格上涨且成交量增加:表示强劲的上升趋势,显示绿色符号(向上箭头)。
- 价格下跌且成交量增加:表示强劲的下降趋势,显示红色符号(向下箭头)。
- 价格上涨且成交量减少:表示上升趋势可能正在减弱,显示橙色警告(警告符号)。
- 价格下跌且成交量减少:表示下降趋势可能正在减弱,也显示橙色警告(警告符号)。
- 如果成交量在上升或下降过程中减少,则绘制警告标记(⚠️)。
摘要
AI 摘要
PVA Volume+Analysis is a technical indicator based on Price-Volume Analysis (PVA), which examines the relationship between price movements and trading volume to assess trend strength and direction. The indicator provides visual signals to help interpret market trends:
- A green up arrow appears when volume increases alongside rising prices, indicating a strong uptrend.
- A red down arrow signals a strong downtrend when volume increases as prices fall.
- An orange warning symbol alerts when volume decreases during rising or falling prices, suggesting the current trend may be weakening.
- A general alert mark (⚠️) is displayed if volume declines during either upward or downward price movements.
This indicator assists traders by highlighting the interplay between price and volume, offering insights into the momentum behind market trends. It is designed for use in technical analysis to support more informed trading decisions.
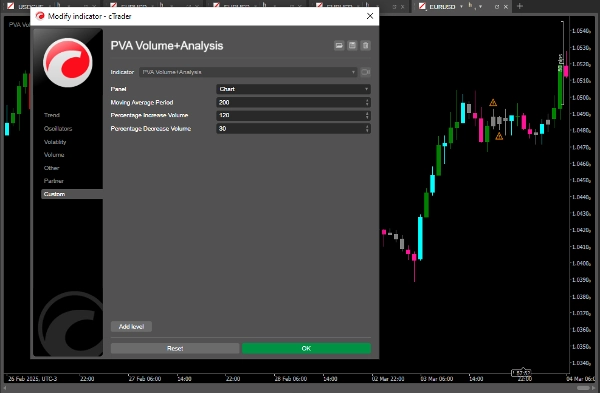
指标配置
客户评价
5.0
评价:3
5 | 100 % | |
4 | 0 % | |
3 | 0 % | |
2 | 0 % | |
1 | 0 % |
客户评价
January 28, 2026
August 12, 2025
Pros: Detailed price-volume analysis, highlights high-activity zones, useful for VSA trading. Cons: No alerts, no MTF mode, can be resource-heavy with large history. Requires experience to interpret.
May 13, 2025
讨论
常见问答
cTrader Store 提供的所有产品,包括交易机器人、指标和插件,均由第三方开发者提供,仅供信息参考和技术访问之用。cTrader Store 并非经纪商,不提供投资建议、个人推荐或任何未来业绩保证。


猜您喜欢


价格
117
销售
9.52K
免费安装