present
Daftar dan dapatkan diskon $50 untuk pembelian pertama Anda
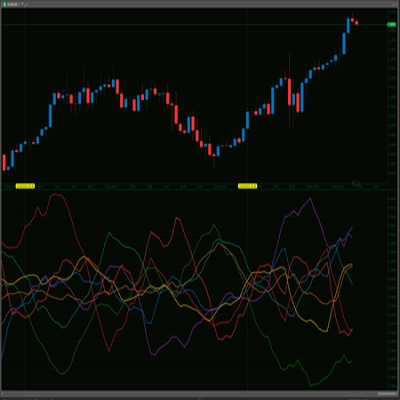
Trading product for Machine Learning Momentum Index Indikator Indices AI, image 1
Machine Learning Momentum Index
4.5
Ulasan: 2
2
Penjualan
7.3K
Instal gratis

Deskripsi

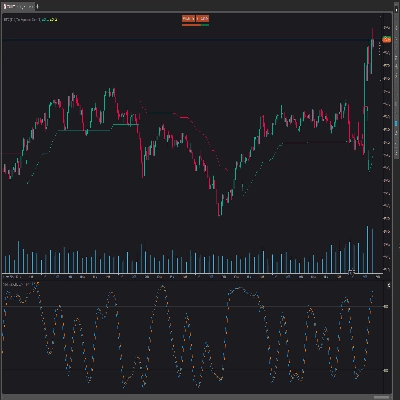
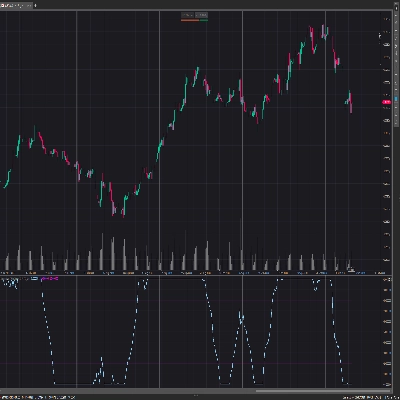
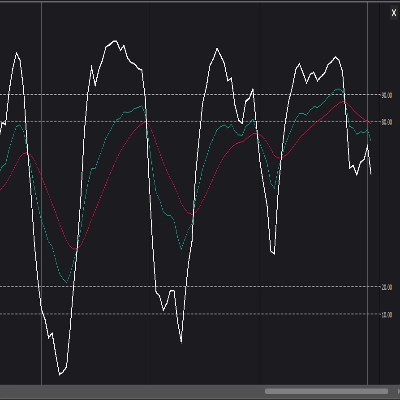
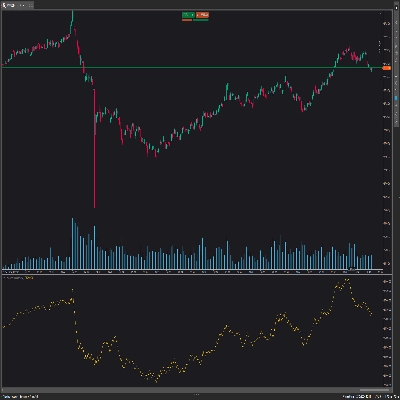
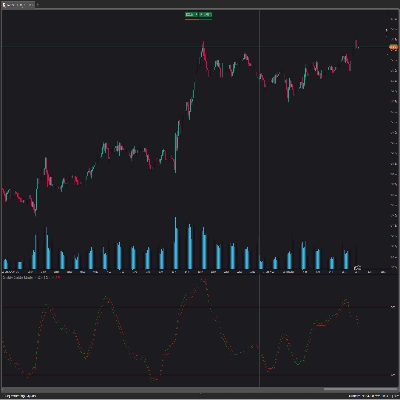
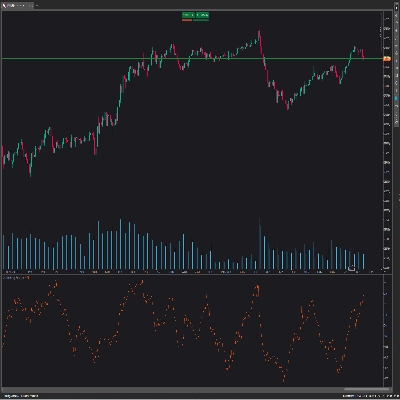
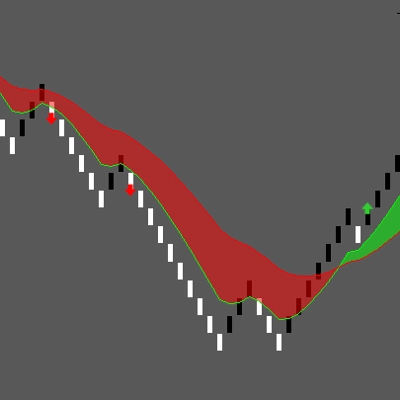
The Machine Learning Momentum Index (MLMI) merepresentasikan langkah berikutnya dalam perdagangan osilator. Dengan menggabungkan analisis momentum tradisional dengan pembelajaran mesin, MLMI memberikan alat yang kuat dan dinamis yang selaras dengan kompleksitas lanskap keuangan modern. Menawarkan para pedagang cara adaptif untuk memahami dan bertindak berdasarkan momentum dan tren pasar, osilator ini menyediakan wawasan waktu nyata tentang momentum pasar dan tren yang sedang berlangsung

Ringkasan

Ringkasan AI
The Machine Learning Momentum Index (MLMI) is an advanced oscillator that integrates traditional momentum analysis with machine learning techniques. Designed to provide real-time insights, MLMI helps traders assess market momentum and identify prevailing trends dynamically. By adapting to the complexities of modern financial markets, this indicator offers an enhanced approach to momentum trading. It is applicable across various indices, including Nasdaq, S&P 500, DAX, and Dow, supporting traders in making informed decisions based on evolving market conditions.
Profil indikator

Diskusi

Ulasan pelanggan

4.5
Ulasan: 2
5
50 %
4
50 %
3
0 %
2
0 %
1
0 %
Ulasan pelanggan
July 9, 2025
Pros: Combines RSI-based WMAs and k‑NN machine learning for adaptive momentum detection. Highlights trend changes and consolidation zones. Cons: No alerts or tooltips. Less effective on higher timeframes. Requires other confirmation tools to trade reliably.
April 26, 2025
Accuracy

Pertanyaan umum

Indices
AI
Produk-produk yang tersedia melalui cTrader Store, termasuk bot trading, indikator, dan plugin, disediakan oleh pengembang pihak ketiga serta hanya ditujukan untuk akses teknis dan informasi. cTrader Store bukan broker dan tidak menyediakan saran investasi, rekomendasi pribadi, atau jaminan apa pun tentang kinerja di masa mendatang.

Produk lain dari penulis ini
Logo "PMAX"
5.0
(6)
Gratis
It's a combination of two trailing stop loss and the other one is well-known ATR-based SuperTrend.
Stochastic RSI (StochRSI) is a technical indicator used to measure the strength and weakness of the RSI.
Laguerre RSI is based on John EHLERS' Laguerre Filter to avoid the noise of RSI.
The KDJ oscillator display consists of 3 lines (K, D and J - hence the name of the display) and 2 levels.
The Darvas Box involves identifying "boxes" or trading ranges where a stock's price consolidates before breaking out.
On Balance Volume (OBV) measures buying and selling pressure as a cumulative indicator.
The Ichimoku Cloud is a comprehensive technical analysis system developed by Japanese journalist Goichi Hosoda
The QQE (Quantitative Qualitative Estimation) Weighted Oscillator improves its original version by weighting the RSI.
Chaikin money flow's primary purpose is to distinguish between periods of accumulation and distribution of a security.

Anda mungkin juga suka

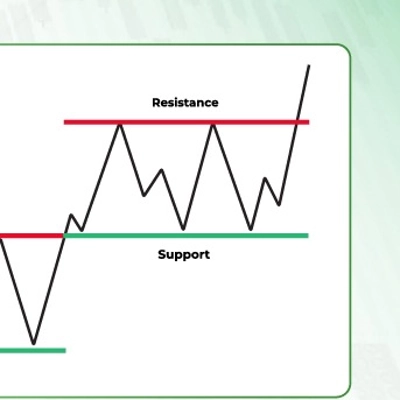
Support and Resistance Line Indicator with Higher Timeframe Filter
RCS: 8 majors! AUD,USD,EUR,JPY,GBP,CAD,CHF,NZD. Find how strong each currency is relatively and trade smarter!
AI-powered daily range forecasts help traders spot volatility opportunities and plan stops and targets.
Custom ADX Indicator for precise trend analysis. المؤشر المخصص ADX لتحليل الاتجاه بدقة
View tick activity across a selected chart range with Point of Control, Value Area High and Value Area Low.
RSI on the main chart with 45/55 momentum levels, overbought/oversold levels, averaged RSI, and multi-timeframe support.
Gold premiun XAUUSD Exclusive Real-Time Adaptive Intelligence
Configure, simulate, and analyze trading strategies with custom filters, multi-target exits, and detailed performance me
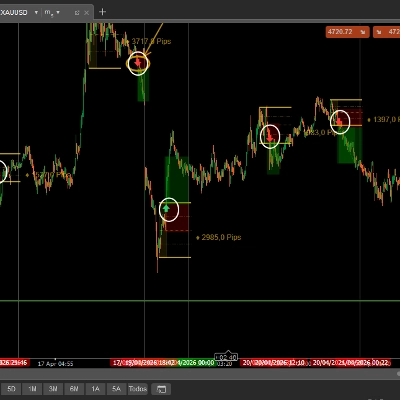
Market structure with BOS and CHoCH, order blocks, and retest buy/sell arrows with entry, stop and two targets
Support and resistance from a rolling volume profile, ranked by strength or recency, updated live.
BOS/CHoCH signals confirmed by liquidity sweep + FVG confluence, with a live conviction score.
Get the exact SuperTrend experience from TV, now perfectly rebuilt for cTrader
Killzone Session and key levels with VWAP – Precision Meets Price Action
Overview of the Fade Breakout Visualizer Indicator
Identifies market compression zones and explosive Breakout moments using mathematical modeling.
Enhance your trading with customizable alerts and dynamic visual tools for trendlines, Fibonacci levels, and more.
Don't trust static support and resistance levels, this indicator combines Fibonacci and VWAP in one powerful tool.
Renko scalping indicator

Harga

2
Penjualan
7.3K
Instal gratis