
Hammer Pattern Indicator
指标
282 下载
版本 1.0, Mar 2025
Windows 版、Mac 版
5.0
评价:1
说明
锤子形态指标 – 策略说明
这个 锤子形态指标 是一个 基于蜡烛图的反转信号,用于识别下跌趋势中的 看涨锤子形态。它旨在检测潜在的趋势反转并突出显示 买入机会。
工作原理
1️⃣ 检测下跌趋势
- 蜡烛的 收盘价 必须 低于3根K线前的收盘价,表明可能存在下跌趋势。
2️⃣ 验证锤子蜡烛结构
- 小实体:蜡烛实体相对较小(≤ 总范围的30%)。
- 长下影线:下影线至少是实体大小的 2倍(显示对低价的强烈拒绝)。
- 短上影线:上影线 ≤ 实体大小的30%(表示顶部阻力较小)。
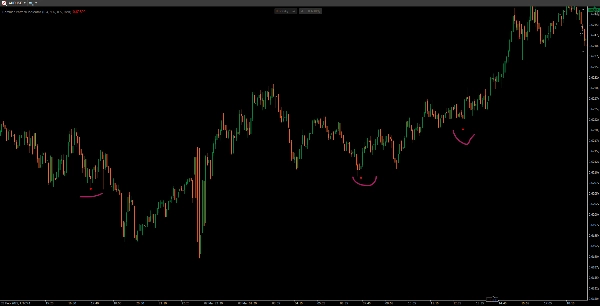
3️⃣ 绘制买入信号
- 如果满足所有条件,红点(或选定颜色)会出现在 锤子蜡烛的最低点稍下方,作为潜在反转的 视觉确认。
主要特点
✅ 通过确保先前的下跌趋势过滤弱信号。
✅ 可自定义参数,包括实体大小、影线长度和颜色。
✅ 简单而有效的蜡烛图形态,适合波段交易者和价格行为交易者。
📌 最佳使用方式: 使用额外指标(例如成交量、支撑位)确认锤子形态,以获得更强的信号!🚀
摘要
指标配置
客户评价
5.0
评价:1
5 | 100 % | |
4 | 0 % | |
3 | 0 % | |
2 | 0 % | |
1 | 0 % |
客户评价
August 18, 2025
Automatically detects hammer candlesticks, customizable, lightweight. Cons: No trend filter, no reliability scoring, possible false signals on low TFs.
讨论
常见问答
Signal
cTrader Store 提供的所有产品,包括交易机器人、指标和插件,均由第三方开发者提供,仅供信息参考和技术访问之用。cTrader Store 并非经纪商,不提供投资建议、个人推荐或任何未来业绩保证。


价格
注册日期 21/02/2025
466.3M
交易量
180.83K
盈利点数
22
销售
6.9K
免费安装