
MACD Pro Trader – 终极MACD交易指标 🚀
您是否在寻找一个强大、专业级的MACD指标来提升您的交易策略? MACD Pro Trader 是为那些希望在交易决策中获得精准、清晰和高性能信号的交易者设计的终极工具。无论您是初学者还是有经验的交易者,这款高级MACD指标都将帮助您识别市场趋势,发现高概率交易机会,并自信地最大化您的利润!
🔥 为什么选择MACD Pro Trader?
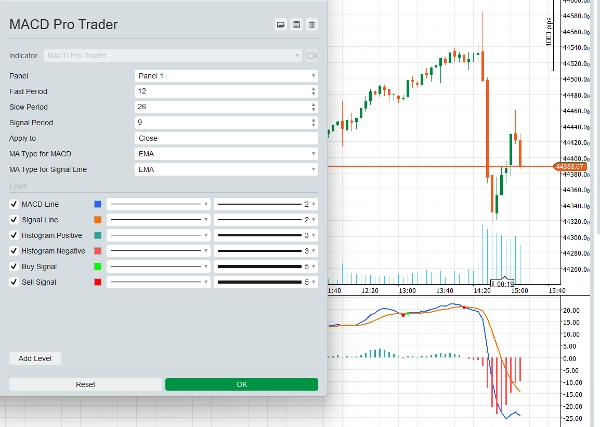
✅ 高级移动平均线自定义 – 可在MACD线和信号线之间选择SMA(简单移动平均线)或EMA(指数移动平均线),让您完全掌控指标如何适应不同的市场条件。
✅ 智能买卖信号 – 通过视觉上明显的绿色和红色标记,清晰显示MACD线何时穿越信号线,提供明确的进出场信号。再也不用对交易入场犹豫不决!
✅ 双色柱状图,更好地展示趋势 – 正负柱状图条采用颜色编码,帮助您瞬间识别动能何时转向有利于您的方向。
✅ 灵活的应用价格选项 – 将MACD计算应用于开盘价、高价、低价、收盘价、中位价、典型价或加权价,以微调指标以适应您的交易风格。
✅ 完美适用于日内交易和波段交易 – 设计适用于外汇、股票、指数和加密货币,无论您是在1分钟图上剥头皮还是在4小时图上交易。
✅ 与cTrader无缝集成 – 完全优化适用于cTrader,实时性能优异且延迟极低,让您在传统MACD指标中占据优势。
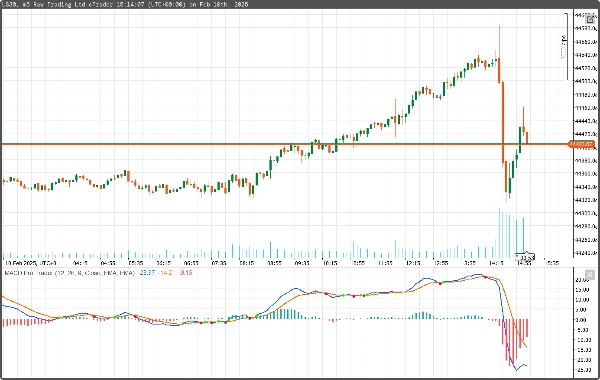
📈 如何使用MACD Pro Trader进行日内交易
策略:MACD交叉 + 动能确认
这个简单而强大的策略旨在捕捉短期价格波动,并在趋势市场中最大化利润。
🔹 第一步:识别趋势
- 使用MACD线和信号线交叉作为您的第一个触发信号。
- 寻找MACD穿越信号线向上,形成看涨形态。
- 寻找MACD穿越信号线向下,形成看跌形态。
🔹 第二步:用柱状图确认
- 一个增长的正柱状图确认强劲的看涨动能。
- 一个增长的负柱状图确认强劲的看跌动能。
- 如果柱状图较弱或平坦,等待更强的信号。
🔹 第三步:入场交易
- 买入入场:当MACD向上穿越信号线且柱状图变绿时。
- 卖出入场:当MACD向下穿越信号线且柱状图变红时。
🔹 第四步:设置止损和止盈
- 止损:将止损设置在最近的摆动低点下方(买入时)或最近的摆动高点上方(卖出时)。
- 止盈:目标为止损的2倍,以获得良好的风险回报比(例如,风险10点获利20点)。
🔹 额外提示:使用更高时间框架进行确认
在入场交易前,检查更高时间框架(例如,交易5分钟图时查看15分钟图)以确认趋势方向。如果两个时间框架一致,您的交易成功概率更高!
🎯 MACD Pro Trader适合谁?
✅ 寻求高准确度MACD信号的外汇交易者。
✅ 需要快速且可靠入场点的剥头皮和日内交易者。
✅ 希望自信跟随趋势的股票和加密货币交易者。
✅ 希望识别长期动能变化的波段交易者。
如果您厌倦了错过绝佳交易机会或难以把握入场时机,MACD Pro Trader就是您一直在等待的解决方案!
💎 立即获取MACD Pro Trader,提升您的交易水平!
🔹 100%为cTrader优化 – 无延迟,无重绘,只有干净、可操作的信号。
🔹 即时下载 – 几分钟内即可开始使用!
🔹 终身更新 – 免费获得所有未来的改进。
📥 立即获取您的副本,开始更聪明地交易! 🚀
5 | 50 % | |
4 | 50 % | |
3 | 0 % | |
2 | 0 % | |
1 | 0 % |


