
说明
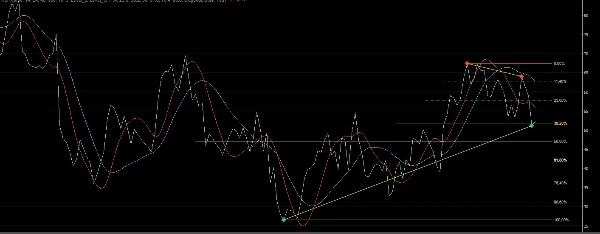
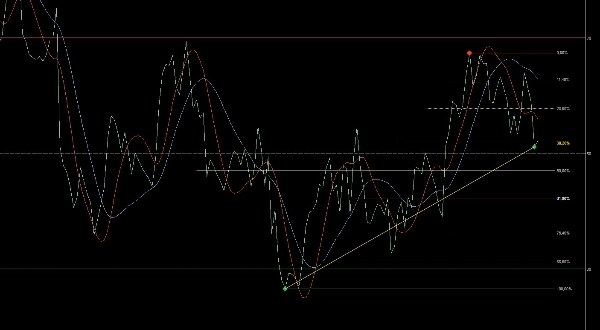
Fibo Trend - Pro 基于著名的 RSI、HULL 和斐波那契指标,为您提供一个先进的技术分析工具,帮助您识别趋势以及市场的进出点。该指标结合了 RSI 测量趋势强度的能力、HULL 平滑价格波动的功能,以及斐波那契识别关键支撑和阻力位的作用。
TSPivotSMC-V2: https://ctrader.com/products/3137?u=Thomas-Sparrow
RangeBoxFibonacci: https://ctrader.com/products/526
OrderPrice-V3: https://ctrader.com/products/397
以及选择
MacdVolume https://ctrader.com/products/267
MarketSession-MX: https://ctrader.com/products/525
摘要
AI 摘要
FiboTrend-Pro V2 is a technical analysis indicator that integrates the Relative Strength Index (RSI), Hull Moving Average (HULL), and Fibonacci indicators. It is designed to assist traders in identifying market trends and optimal entry and exit points. The RSI component measures trend strength, the HULL indicator smooths price movements to reduce noise, and Fibonacci levels highlight key support and resistance areas. This combination provides a comprehensive tool for analyzing price action across various markets including Forex, indices, commodities, cryptocurrencies, and stocks. The indicator supports multiple timeframes and is suitable for traders seeking to enhance their market timing using established technical methods.
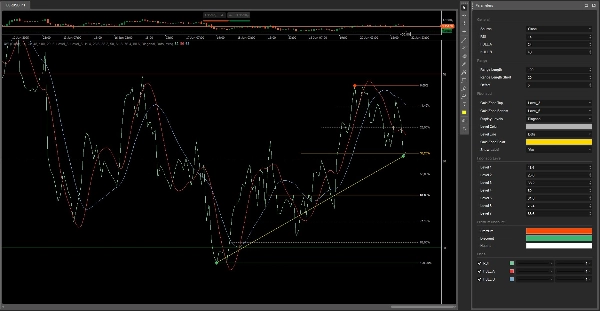
指标配置
客户评价
5.0
评价:1
5 | 100 % | |
4 | 0 % | |
3 | 0 % | |
2 | 0 % | |
1 | 0 % |
客户评价
August 28, 2025
Improved swing detection, cleaner interface, stable performance.FiboTrend-Pro V2 is a valuable improvement, especially for swing and position traders
讨论
常见问答
Forex
Indices
Commodities
RSI
Crypto
Stocks
cTrader Store 提供的所有产品,包括交易机器人、指标和插件,均由第三方开发者提供,仅供信息参考和技术访问之用。cTrader Store 并非经纪商,不提供投资建议、个人推荐或任何未来业绩保证。
该作者的其他作品


猜您喜欢


价格
147
销售
11.17K
免费安装