
说明
该技术分析指标提供有关市场情绪、趋势和价格水平的信息。它使用成交量、开盘收盘价、Chaikin波动率和Chaikin资金流等数据来计算市场情绪。它还允许您调整价差、检测趋势并可视化价格水平和点数。它是识别市场主导力量、预测价格走势和改进交易决策的有用工具。
在说明中,我指出了重要参数;其余的是样式配置,如颜色、线型和字体大小。
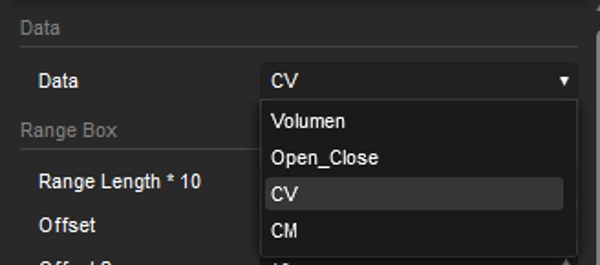
数据
情绪计算基于从成交量、开盘收盘价、Chaikin波动率和Chaikin资金流中选择的数据。
区间长度 * 10
该值表示计算所基于的蜡烛(周期)数量——该值乘以10。
添加缩放
为了保持图表居中,这也有助于考虑盘整和趋势变化等情况。
边距
允许调整上下边距以改善可视化效果。
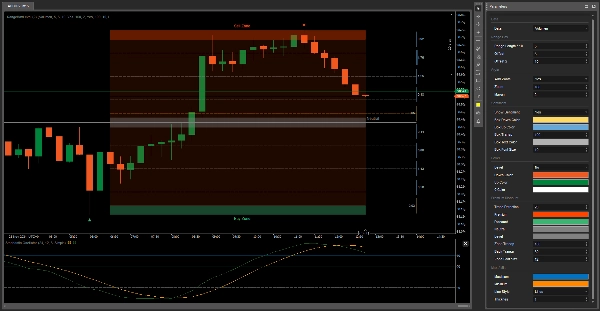
显示情绪
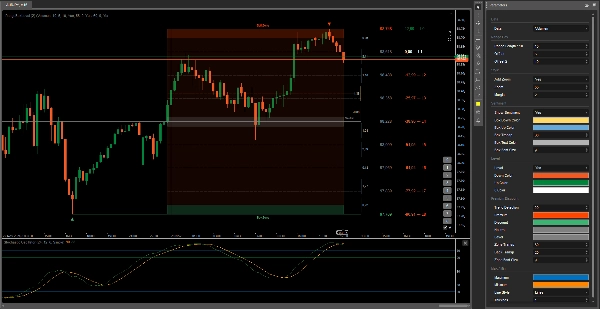
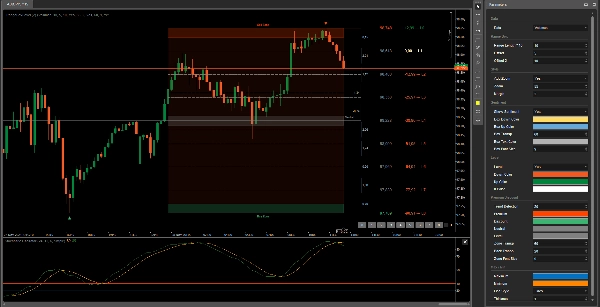
情绪表示当前市场中哪种力量更强。如果黄色柱状图增大,表示卖方更多,反之亦然。如果您不希望看到情绪可视化,可以在右侧隐藏它。
水平
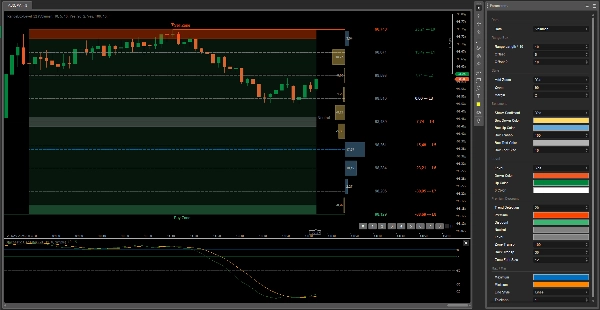
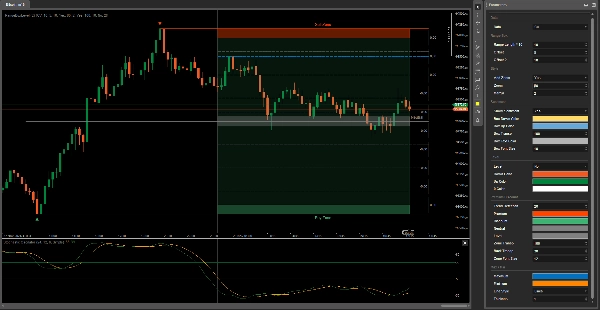
这是一个额外功能,可用作每个水平的价格和点数参考。当您选择想要下买单的水平时,它显示价格可能达到的每个水平的点数。
趋势检测
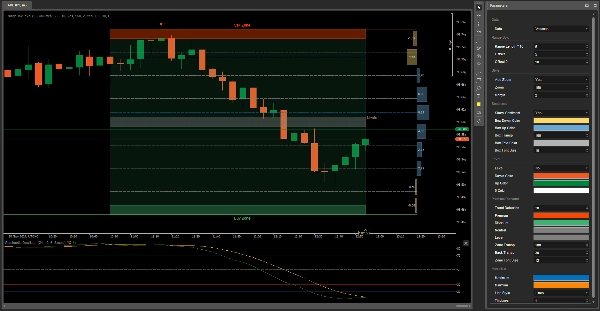
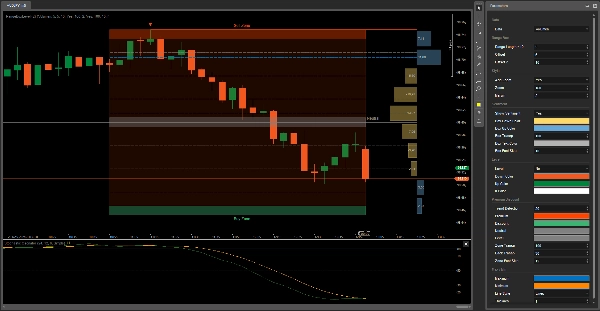
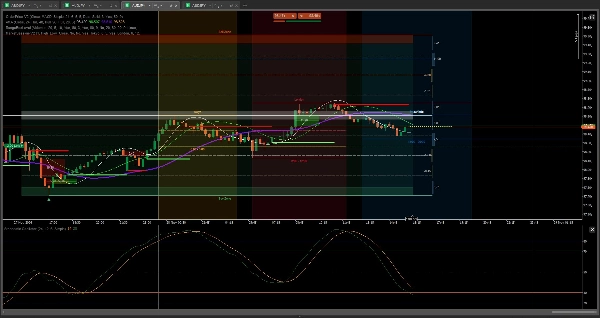
根据资产的趋势,区间框的背景颜色会变化:如果是看涨则为绿色,若看跌则为红色。
最大 / 最小
这些是根据价格可能走向预测而改变位置的蓝色和黄色线条。区间框被分为9个部分,帮助确定价格拐点,作为斐波那契回撤使用。
你将所向披靡
祝你好运 😀
摘要
AI 摘要
RangeBoxLevel is a technical analysis indicator designed to provide insights into market sentiment, trend direction, and key price levels. It calculates market sentiment using selectable data inputs including Volume, Open-Close price differences, Chaikin Volatility, and Chaikin Money Flow. The indicator allows customization of parameters such as range length (based on multiples of 10 candles), chart zoom to maintain centering during consolidation or trend changes, and margin adjustments for improved visualization.
Key features include sentiment visualization with bars indicating the dominance of buyers or sellers, trend detection through background color changes (green for bullish, red for bearish), and level indicators that display potential price and pip targets for placing orders. The Range Box is divided into nine sections to identify price inflection points, functioning similarly to Fibonacci retracement levels, with dynamic max/min lines predicting possible price movements.
This tool supports analysis across various markets including stocks, cryptocurrencies, indices like NAS100, and commodities such as XAUUSD (gold). It is suitable for trading strategies like scalping and grid trading and can assist traders in anticipating price movements and making informed decisions. The indicator integrates with additional tools for enhanced order price management and market session analysis.
指标配置
客户评价
5.0
评价:2
5 | 100 % | |
4 | 0 % | |
3 | 0 % | |
2 | 0 % | |
1 | 0 % |
客户评价
August 18, 2025
Combines volume, open-close and Chaikin volatility to define meaningful price levels. Visually clear and flexible settings. Cons: No tooltips or alerts. Lacks template saving and level history. Needs confirmation via PA or volume.
December 10, 2024
No reason to yolo this live without a few normal sessions. 2 higher timeframe candles keeps the first run grounded.
讨论
常见问答
Prop
Scalping
Crypto
Grid
Stocks
XAUUSD
NAS100
cTrader Store 提供的所有产品,包括交易机器人、指标和插件,均由第三方开发者提供,仅供信息参考和技术访问之用。cTrader Store 并非经纪商,不提供投资建议、个人推荐或任何未来业绩保证。
该作者的其他作品


猜您喜欢


价格
147
销售
11.2K
免费安装