
说明
价格跳跃退出和重新进入(PjER)指标 是基于学术论文 “Koegelenberg & van Vuuren (2024) 的《一种用于日内交易的动态价格跳跃退出和重新进入策略》”,发表于《Expert Systems With Applications》期刊。
关键创新
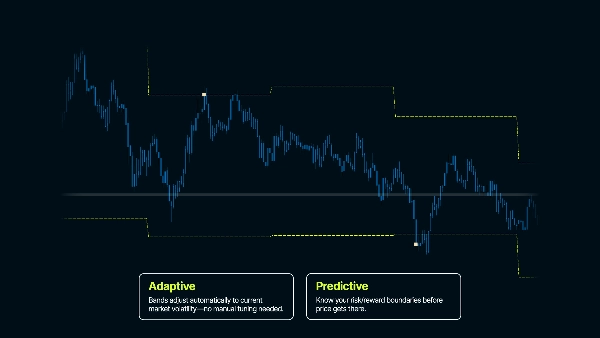
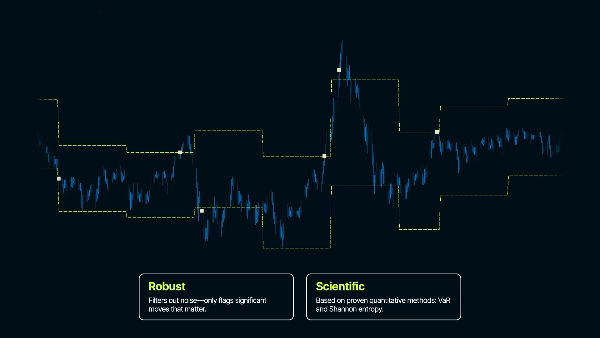
- 在潜在损失发生前的VaR估计
- 对短期强劲市场趋势的稳健性
- 跳跃后市场修正分析以确定安全的重新进入时机
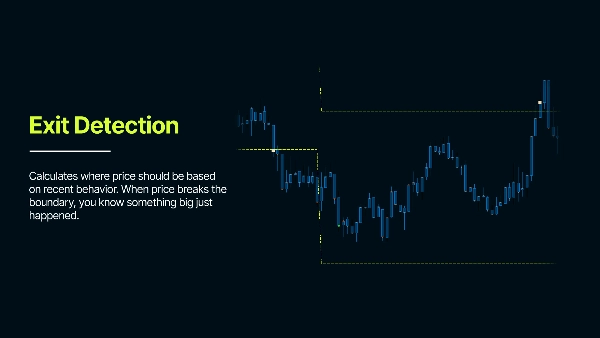
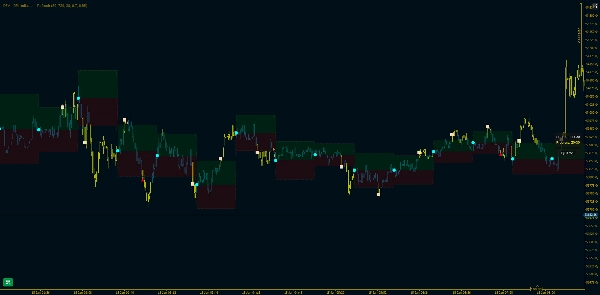
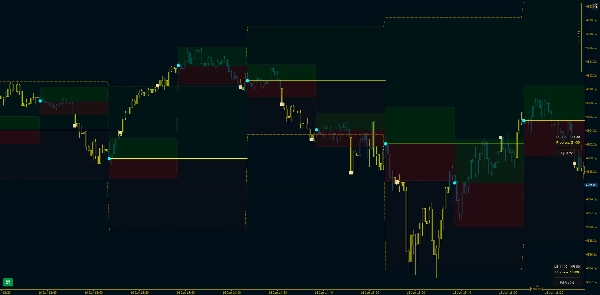
它分析过去的价格变动以了解典型波动性,并创建置信区间——代表预期价格范围。当价格跳出这些区间时,表明发生了异常情况。
目标使用场景
日内交易(尤其是基于区间的策略)。该指标围绕价格创建统计边界,以检测异常价格变动。在正常市场行为中,价格基于近期波动性保持在预期范围内。当价格突破这些区间时,表明市场结构发生了变化——可能是交易的退出点或突破信号,因为市场行为已改变。
核心参数说明
最大回溯天数 - 决定指标开始工作的历史时间长度
GMT偏移 - 调整您的时区,确保日期计算与本地时间匹配
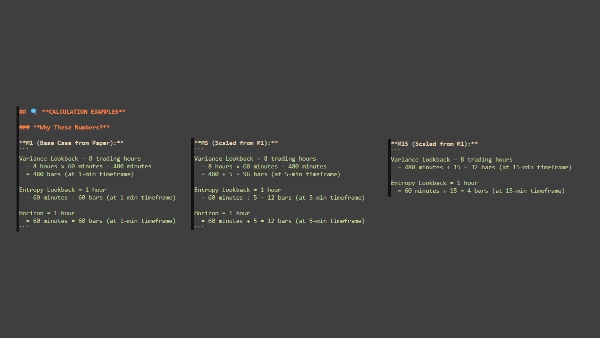
回溯周期(柱数)
“我应该使用多少价格历史来衡量‘正常’行为?”
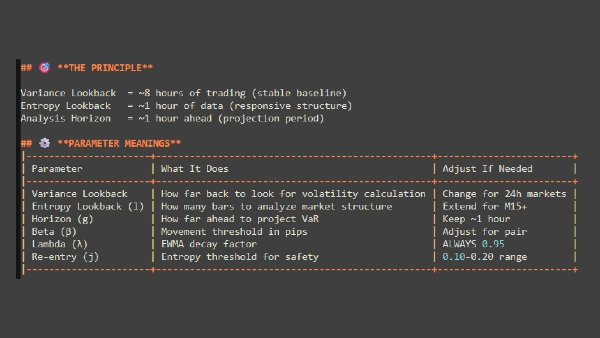
- 用于计算波动性的历史柱数
- 柱数越多=更稳定但适应较慢;柱数越少=反应更快但噪声更大
- 示例:M1上1440柱=24小时数据
分析周期(柱数)
“我应该观察价格多久后重新开始?”
- 每个分析周期持续多长时间,之后区间重置
- 设定分析的时间框架——周期短=更频繁重置,周期长=区间保持更久
- 示例:60柱=区间保持60柱,然后从新参考价格重新计算
风险概率
“我希望多大程度上确定价格通常不会达到这些水平?”
- 设置区间的置信水平(类似安全边际)
- 值越高=区间越宽(信号越少),值越低=区间越窄(信号越多)
- 示例: 0.80 = 80%置信度下价格在正常条件下保持在区间内
衰减因子(λ - Lambda)
“我应该更关注刚发生的情况,还是对所有历史数据一视同仁?”
- 控制在波动性计算中近期数据与旧数据的权重分配
- 值越高=近期数据更重要;值越低=所有数据权重更均等
- 示例 0.95 = 近期波动性对计算影响较大
重要提示
这是一个风险管理工具 – 识别波动事件和一段时间内的稳定性
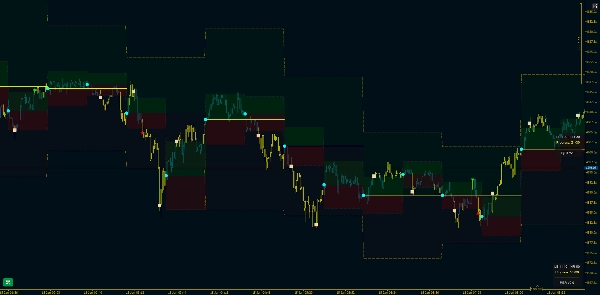
置信区间至关重要 – 区间不能像ATR那样跟随价格变化 – 区间是为每个分析周期计算的
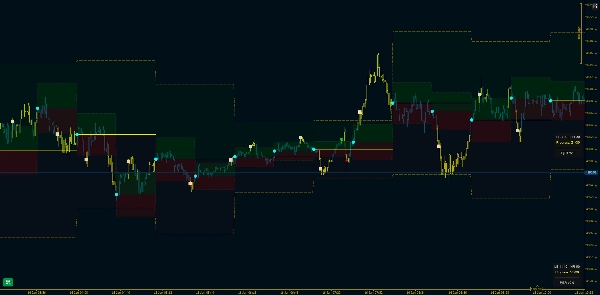
重新进入需要耐心 – 不要期望退出后立即重新进入 – 市场需要时间稳定
参数针对资产和时间框架特定 – 默认参数为起点 – 针对您的具体市场和风格进行优化 – 在外汇中有效的参数可能不适用于指数、金属或加密货币。
( * ) 本指标仅供教育和信息用途。它不构成财务或投资建议。本产品、其文档或任何相关材料中的内容均不应被视为买入、卖出或持有任何金融工具的推荐。金融市场交易涉及重大风险,可能不适合所有投资者。过去的表现不代表未来结果。无法保证盈利,用户可能遭受重大损失。使用本指标即表示您承认对自己的交易决策和财务结果负全部责任。本产品的创建者不对因使用本产品直接或间接产生的任何损失或损害承担责任。请在做出任何交易决策前务必自行进行分析。
摘要
AI 摘要
WT - PJER (Price Jump Exit and Re-entry) is a risk management indicator designed for intraday trading across markets including Forex, Indices, Commodities, and Crypto. Based on the 2024 academic paper by Koegelenberg & van Vuuren, it uses statistical analysis of past price movements to establish dynamic confidence intervals that adapt to real-time volatility. These intervals represent expected price ranges; price movements outside these bands indicate abnormal market behavior, signaling potential exit points or structural breakouts.
Key features include Value at Risk (VaR) estimates to anticipate potential losses, robustness against strong short-term trends, and analysis of post-jump corrections to identify safe re-entry timings. Core adjustable parameters allow users to tailor the indicator to specific assets and timeframes, including lookback period for volatility calculation, analysis horizon for band recalculation frequency, risk probability to set confidence levels, and decay factor to weight recent versus older data.
The indicator emphasizes patience for re-entry after exits, as market stabilization is required. It is intended as a tool for identifying volatility events and managing risk rather than providing direct trade signals. Users should optimize parameters according to their trading style and market conditions.
指标配置
客户评价
5.0
评价:1
5 | 100 % | |
4 | 0 % | |
3 | 0 % | |
2 | 0 % | |
1 | 0 % |
客户评价
November 30, 2025
WT-PJER aims to flag volatility spikes and market momentum, giving traders early heads-up on potential big moves. A handy volatility & impulse filter, but not a standalone signal generator. Works best when paired with structure/volume confirmation. More reliable on mid to higher timeframes. Alerts and clear signal definitions would make it stronger.
讨论
常见问答
Forex
Signal
Breakout
Indices
Commodities
Crypto
cTrader Store 提供的所有产品,包括交易机器人、指标和插件,均由第三方开发者提供,仅供信息参考和技术访问之用。cTrader Store 并非经纪商,不提供投资建议、个人推荐或任何未来业绩保证。
该作者的其他作品


价格
88.59M
交易量
105.61K
盈利点数
74
销售
454
免费安装