
Volume Profile Pro
Indicador
8 compras
Versión 1.0, Oct 2025
Windows, Mac
5.0
Valoraciones: 3
Descripción
Volume Profile Pro es una herramienta profesional de análisis de volumen de rango fijo diseñada para un mapeo preciso de la estructura del mercado y la liquidez.
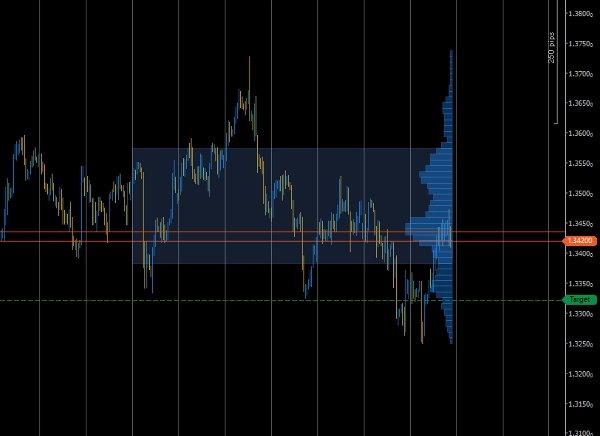
Te permite visualizar cuánta actividad comercial ocurrió en cada nivel de precio dentro de un rango definido en el gráfico, ayudándote a identificar instantáneamente zonas de interés como nodos de alto volumen, el Punto de Control (POC) y el Área de Valor del 70%.
Características clave
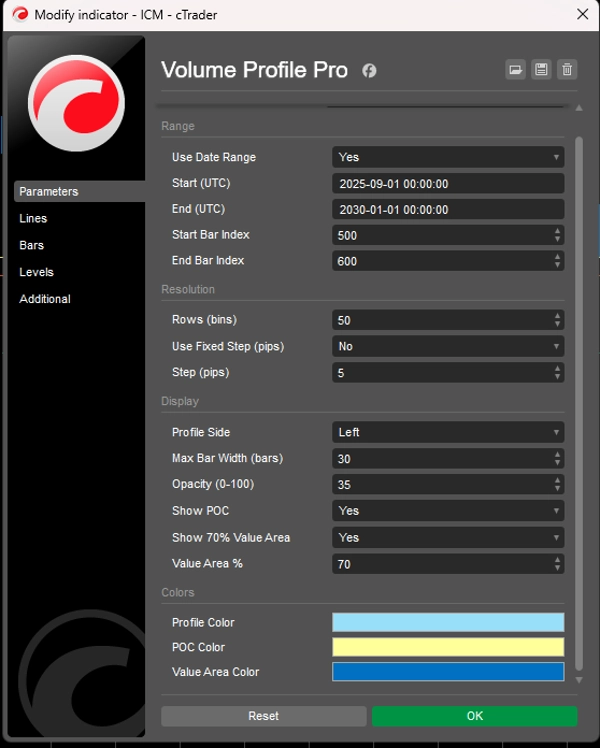
- 🧭 Selección de rango fijo – Define un rango personalizado por fecha o índice de barra para analizar solo la región que te interesa.
- 📊 Distribución precisa del volumen – Construye un histograma de volumen a partir del volumen de ticks en el rango elegido.
- 🎯 POC y Área de Valor – Resalta automáticamente el Punto de Control y la banda del área de valor del 70%.
- ⚙️ Resolución flexible – Conteo de bins ajustable o paso fijo en pips para granularidad personalizada.
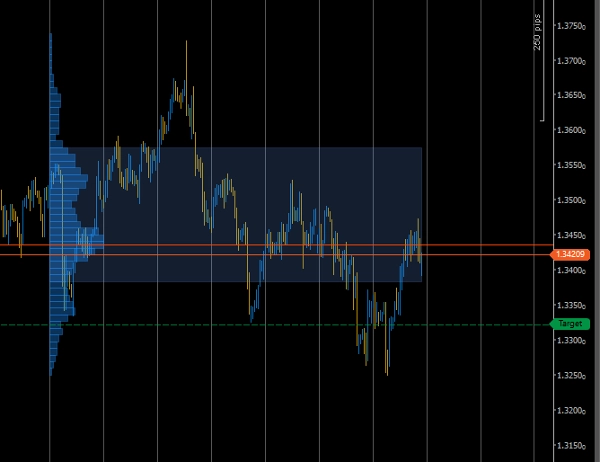
- 🎨 Visualización limpia – Elige el lado (izquierda/derecha), escala de ancho y opacidad para una legibilidad óptima del gráfico.
- ⚡ Ligero y optimizado – Cálculo eficiente para estudios de volumen en tiempo real sin ralentizar tu terminal.
Cómo funciona
- Elige si usar Rango de fechas o Rango de índice de barras.
- Define tus parámetros de inicio / fin.
- El indicador calcula el volumen de ticks en cada paso de precio y traza barras horizontales que muestran la actividad relativa.
- La barra más larga marca el POC, y una región ligeramente sombreada muestra el Área de Valor (por defecto 70%).
Ideal para
- Operadores intradía y swing que analizan la concentración de liquidez.
- Desarrolladores de estrategias basadas en volumen que buscan zonas basadas en datos.
- Operadores que usan niveles de reversión/confluencia de POC o Área de Valor.
Resumen
Resumen de IA
Volume Profile Pro is a fixed-range volume analysis indicator designed to visualize trading volume distribution by price within a user-defined chart range. It calculates tick volume at each price level and displays a horizontal histogram that highlights key market structure elements such as the Point of Control (POC)—the price with the highest traded volume—and the 70% Value Area, representing the price range where most trading activity occurred. Users can select the analysis range by date or bar index and adjust the resolution through customizable bin counts or fixed pip steps. The indicator offers flexible visualization options, including side placement, width scaling, and opacity adjustments, to enhance chart readability. Its efficient computation supports real-time volume studies without impacting terminal performance. Volume Profile Pro is suitable for intraday and swing traders, volume-based strategy developers, and those utilizing POC or Value Area levels for trading decisions. It supports multiple markets and symbols, including Forex pairs (EURUSD, GBPUSD, NZDUSD, USDJPY), cryptocurrencies (BTCUSD), commodities (XAUUSD), indices (NAS100), and stocks.
Perfil del indicador
Valoraciones de clientes
5.0
Valoraciones: 3
5 | 100 % | |
4 | 0 % | |
3 | 0 % | |
2 | 0 % | |
1 | 0 % |
Valoraciones de clientes
October 20, 2025
Practical market note if the trader wants it adds useful information behind the price move. It works best as support, not a final decision maker. Volume context is stronger when POC, VWAP and value area agree across 2 sessions. volume alone can be noisy without price action.
October 19, 2025
October 19, 2025
Focused demo option for traders who want confirmation beyond candles. It gives value around volume based context, but volume alone can be noisy without price action. I would review 20 reactions near POC or VWAP before trusting the read. The data helps most when price action confirms the same zone.
Conversación
Preguntas frecuentes
BTCUSD
Prop
Forex
Indices
Commodities
Crypto
Stocks
Los productos disponibles a través de cTrader Store, incluidos bots, indicadores y plugins para operar, son proporcionados por desarrolladores de terceros y están disponibles únicamente con fines informativos y de acceso técnico. cTrader Store no es un bróker, por lo que no proporciona asesoramiento de inversión, recomendaciones personales ni ninguna garantía de rentabilidad futura.


Precio
Desde 31/10/2024
56
Ventas
1.75K
Instalaciones gratis