
Descripción
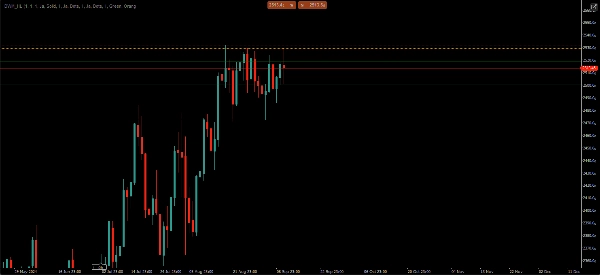
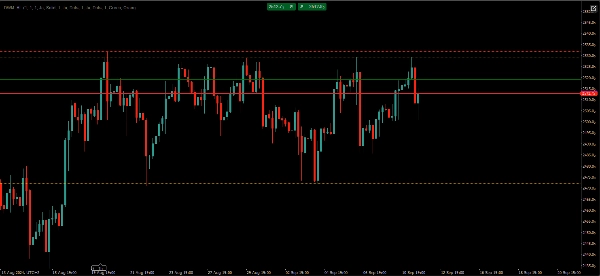
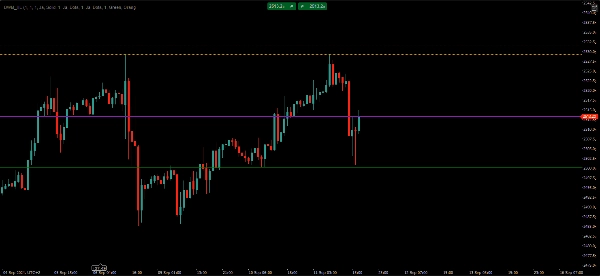
Niveles de Liquidez NGS – Máximos y Mínimos Diarios • Semanales • Mensuales
Opera alrededor de la liquidez, no alrededor de líneas aleatorias.
Niveles de Liquidez NGS muestra automáticamente los niveles de liquidez Diarios, Semanales y Mensuales más importantes en cada gráfico.
• Sin dibujo manual
• Sin cambio de marco temporal
• Sin saturación del gráfico
Este indicador fácil de usar ayuda a los traders a identificar niveles clave de liquidez y estructura de mercado en segundos. En lugar de marcar manualmente los máximos y mínimos cada día, los niveles más importantes se muestran y actualizan automáticamente para ti.
Características:
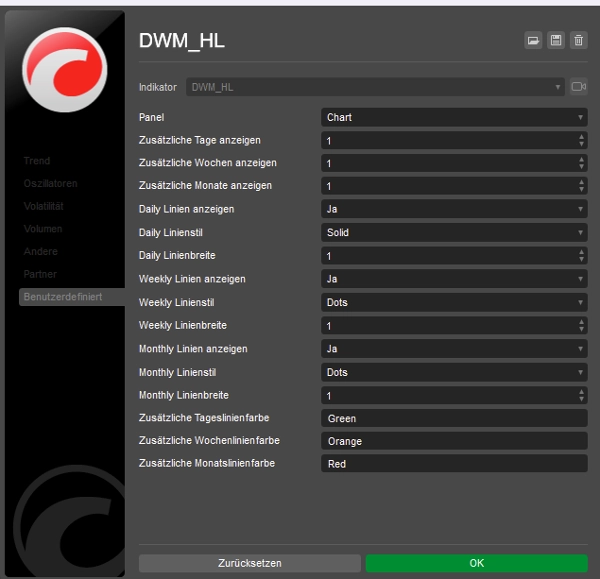
• Niveles automáticos de Máximos y Mínimos Diarios
• Niveles automáticos de Máximos y Mínimos Semanales
• Niveles automáticos de Máximos y Mínimos Mensuales
• Niveles opcionales del período anterior
• Colores y estilos de línea personalizables
• Visualización limpia y ligera en el gráfico
• Funciona en Forex, Índices, Commodities y Cripto
• Soporta múltiples marcos temporales
• No repinta
Diseñado para traders que se enfocan en la estructura del mercado, la liquidez y niveles de marcos temporales superiores.
Sin señales.
Sin estrategia.
Sin promesas de ganancias.
Solo niveles objetivos de liquidez y un flujo de trabajo de trading más limpio.
Resumen
Valoraciones de clientes
5 | 100 % | |
4 | 0 % | |
3 | 0 % | |
2 | 0 % | |
1 | 0 % |


