
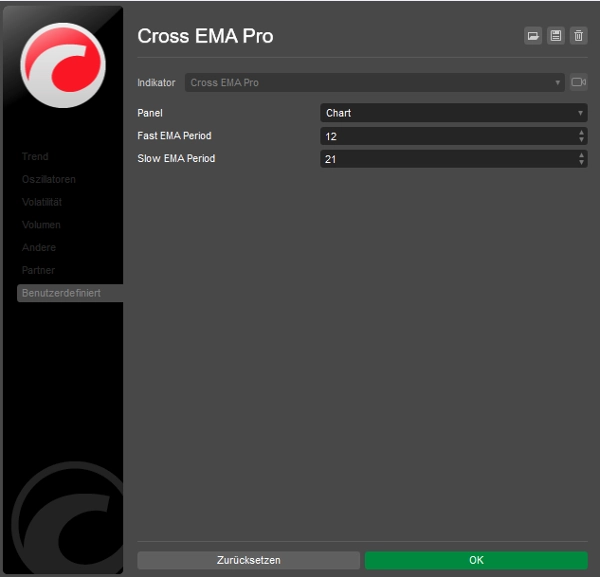
Cross EMA Pro
Indicador
2 compras
Versión 1.0, Sep 2024
Windows, Mac
4.5
Valoraciones: 2
Descripción
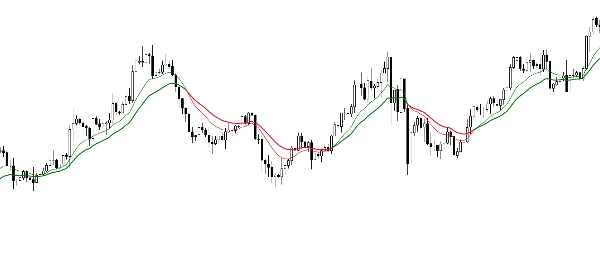
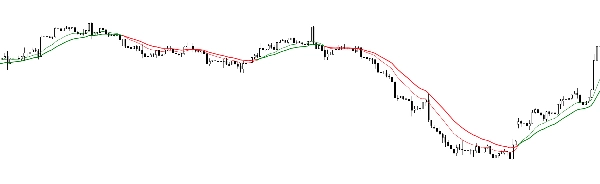
El Cross EMA Pro te ayuda a identificar con precisión los cambios de tendencia al visualizar el cruce de las EMAs de 12 y 21 periodos. La codificación por colores facilita detectar rápidamente las direcciones de la tendencia.
- Señales de cruce: Basadas en las EMAs de 12 y 21 periodos
- Codificado por colores: Verde para tendencias alcistas, rojo para tendencias bajistas
- Uso flexible: Adecuado para scalping, trading diario y estrategias a largo plazo
Resumen
Resumen de IA
Cross EMA Pro is a trend reversal indicator that visualizes the crossover of 12-period and 21-period exponential moving averages (EMAs). It uses color coding—green for uptrends and red for downtrends—to help users quickly identify trend directions. The indicator provides clear crossover signals based on these two EMAs, making it suitable for various trading styles including scalping, day trading, and long-term strategies. It supports multiple markets such as Forex, stocks, indices, commodities, and cryptocurrencies including BTCUSD and XAUUSD. The indicator outputs visual signals on price charts to assist traders in recognizing potential trend reversals.
Perfil del indicador
Categoría del indicador
Tendencia
Tipo de resultado
Visualización
Requisitos de datos
Únicamente barras
Valoraciones de clientes
4.5
Valoraciones: 2
5 | 50 % | |
4 | 50 % | |
3 | 0 % | |
2 | 0 % | |
1 | 0 % |
Valoraciones de clientes
September 22, 2024
September 22, 2024
No reason to yolo this live without a few normal sessions, and M15 is enough for the first pass.
Conversación
Preguntas frecuentes
BTCUSD
Forex
Indices
Commodities
Crypto
Stocks
XAUUSD
Los productos disponibles a través de cTrader Store, incluidos bots, indicadores y plugins para operar, son proporcionados por desarrolladores de terceros y están disponibles únicamente con fines informativos y de acceso técnico. cTrader Store no es un bróker, por lo que no proporciona asesoramiento de inversión, recomendaciones personales ni ninguna garantía de rentabilidad futura.
Más de este autor


Precio
Desde 11/09/2024
7
Ventas