
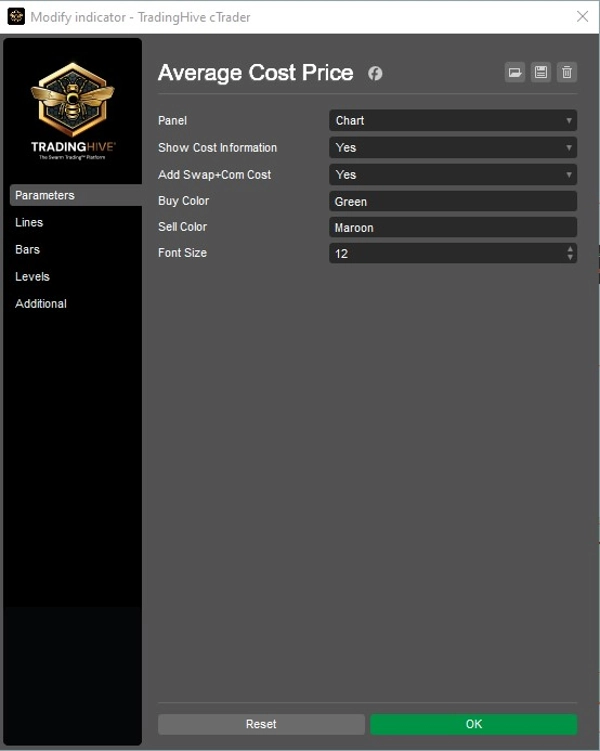
Average Cost Price
Chỉ báo
1 lượt mua
Phiên bản 1.0, Sep 2025
Windows, Mac
4.5
Đánh giá: 2
Mô tả
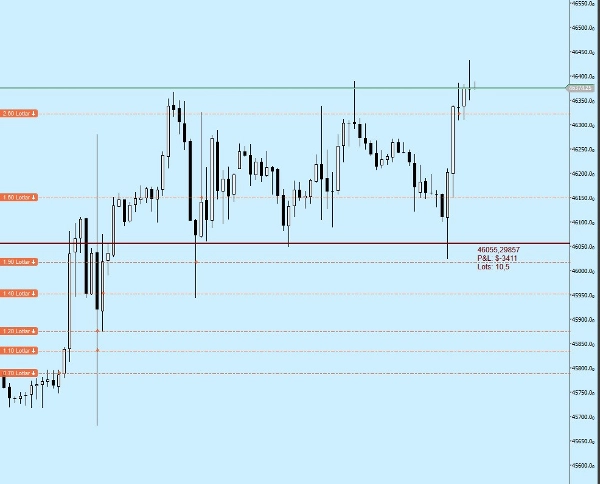
Xác định giá vốn trung bình cho nhiều giao dịch là khó khăn. Việc đặt Stop Loss và Take Profit cũng khó vì giá trung bình của nhiều giao dịch không xác định được.
Chỉ báo Giá Vốn Trung Bình cung cấp cho bạn:
* Đường giá Mua hoặc Bán trung bình,
* Tổng lợi nhuận hoặc lỗ dựa trên đường Giá Vốn Trung Bình,
* Tổng số lượng Lot
Tóm tắt
Tóm tắt AI
Average Cost Price is a trading indicator designed to help traders monitor their open positions directly on the chart. It calculates and displays the average buy or sell price line for multiple trades, simplifying the process of managing positions with varying entry prices. The indicator also shows the total profit or loss amount based on this average cost line, providing a clear overview of overall position performance. Additionally, it tracks the total lot quantity held. This tool supports various markets including Forex, Stocks, Commodities, Crypto, and Indices, and is applicable to symbols such as BTCUSD, EURUSD, GBPUSD, XAUUSD, and USDJPY. By consolidating multiple trade entries into a single average cost metric, it aids in setting more accurate Stop Loss and Take Profit levels.
Hồ sơ chỉ báo
Đánh giá của khách hàng
4.5
Đánh giá: 2
5 | 50 % | |
4 | 50 % | |
3 | 0 % | |
2 | 0 % | |
1 | 0 % |
Đánh giá của khách hàng
October 3, 2025
ngl, trade control feels cleaner and that is enough to keep testing it. Win rate means less without average R.
October 1, 2025
The tool feels better once the workflow feels calmer, and spread and slippage need a line in the notes.
Thảo luận
Câu hỏi thường gặp
BTCUSD
Prop
Forex
Indices
EURUSD
Commodities
GBPUSD
Crypto
Stocks
XAUUSD
USDJPY
Các sản phẩm có sẵn trên cTrader Store, bao gồm bot giao dịch, chỉ báo và plugin, được cung cấp bởi các nhà phát triển bên thứ ba và chỉ nhằm mục đích cung cấp thông tin và tiếp cận kỹ thuật. cTrader Store không phải là nhà môi giới và không cung cấp lời khuyên đầu tư, khuyến nghị cá nhân hay bất kỳ đảm bảo nào về hiệu suất trong tương lai.


Giá
Kể từ 01/09/2025
1
Lượt bán