
Descripción
🚀 Sistema de Ruptura de Canal
Este algoritmo especializado está diseñado para confirmar puntos de entrada y salida con precisión 🎯 combinando múltiples elementos de análisis técnico para proporcionar señales confiables.
🔍 ¿Cómo Funciona?
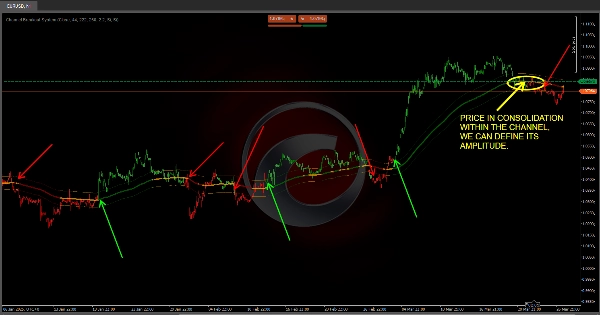
📊 Canal Basado en Volatilidad (ATR)
✅ La volatilidad del mercado se calcula usando el ATR (Rango Verdadero Promedio) 📉.
✅ La "MA de Tendencia" se ajusta sumando y restando un valor proporcional a esta volatilidad, formando dos líneas punteadas que actúan como un "techo" y "piso" del mercado.
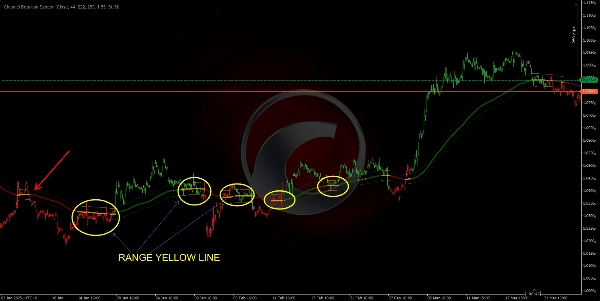
✅ ¿Qué significa esto para ti? Si el precio se mantiene dentro del canal, el mercado puede estar en rango o consolidación; si rompe claramente, es una señal de un movimiento de tendencia fuerte 📈📉.
✅ ¡Totalmente personalizable! Ajusta la configuración del canal para que coincida con tu estrategia 📌.
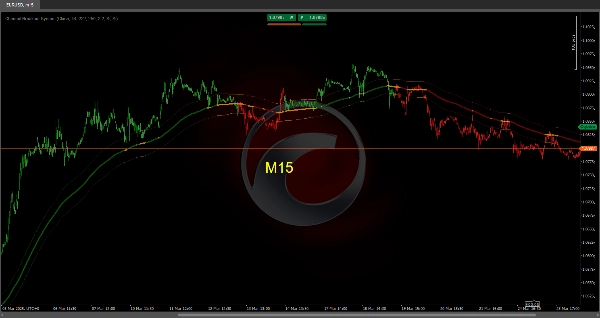
🟢 Detección de Tendencia con Colores Inteligentes
🔹 El indicador compara la posición de la MA rápida con la MA media, y ambas en relación con la MA de Tendencia.
🔹 Según la fase del mercado, las velas cambian de color:
- 🟢 Verde → Fase alcista del mercado.
- 🔴 Rojo → Fase bajista del mercado.
- 🟠 Naranja o neutral → Posible consolidación o incertidumbre.
🔹 Si el precio y las medias móviles están "atrapados" dentro del canal, señala una fase de consolidación, ayudándote a evitar operar en zonas indecisas.
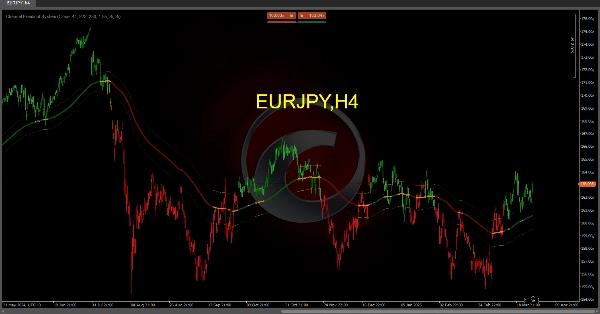
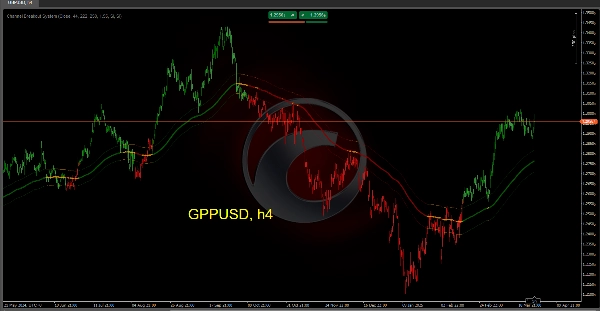
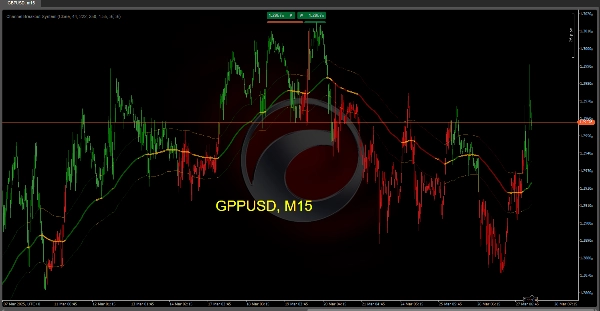
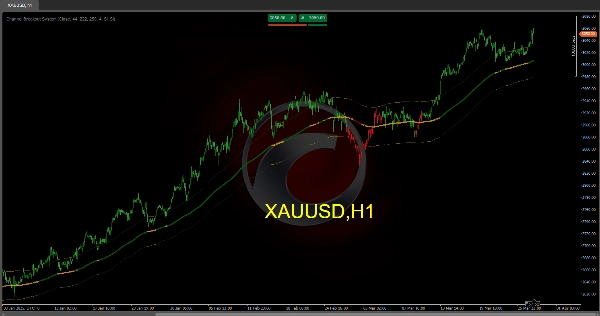
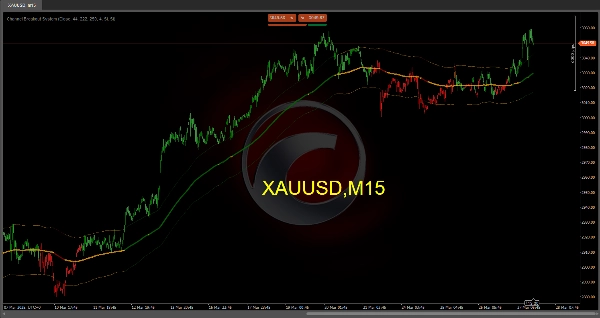
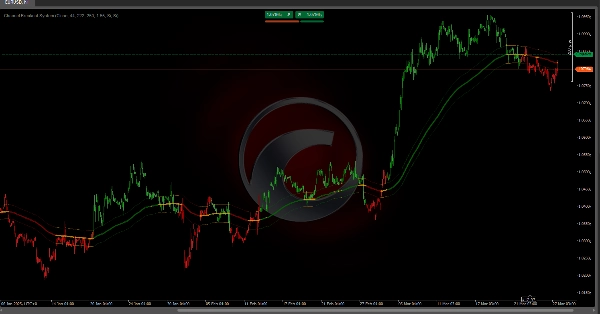
🎯 Cómo Se Ve en el Gráfico
🔵 Línea de tendencia principal: Cambia de color según la dirección del mercado (verde, rojo o naranja).
📏 Canal punteado: Refleja el rango del mercado basado en la volatilidad.
📊 Barras coloreadas: Proporcionan una representación visual fácil de la fase actual del mercado.
🚀 ¿Por Qué Usar Este Sistema?
✔ Identifica rápidamente si el mercado está en tendencia o en rango.
✔ Resalta visualmente la fuerza y dirección de la tendencia.
✔ Anticipa posibles reversiones con señales claras de ruptura y cruces.
✔ Confirma puntos de entrada y salida, reduciendo señales falsas y mejorando la precisión en las operaciones.
🔹 Optimiza tu trading y opera con mayor confianza usando Sistema de Ruptura de Canal 🏆. ¡Prepárate para detectar las mejores oportunidades del mercado! 📈🔥
Indicadores de Ctrader Store:
Sesiones de Brecha de Valor Justo
Estructura Dinámica del Mercado
Análisis de Puntos de Giro
Regresión Lineal de Fibonacci
Multitemporal
Brecha de Valor Justo de Momentum
Proyección de Flujo de Mercado
Gradiente de Tendencia Dinámico
Sesgo de Velas Multinivel
Rastreador
Rastreador de Extremos Zig-Zag
Líneas de Tendencia de Soporte y
Resistencia Automáticas
Todos los Niveles de Soporte y
Resistencia
Mapa de Liquidación por Apalancamiento
Resumen
The system features smart color-coded trend detection by comparing fast, medium, and trend MAs, with candles changing color to indicate market phases: green for bullish, red for bearish, and orange for consolidation or uncertainty. This visual aid helps identify trend strength, direction, and potential consolidation zones.
On the chart, the main trend line changes color based on market direction, the dotted channel reflects volatility-based range, and colored bars provide an easy visual representation of the current market phase.
The indicator is fully customizable to fit different trading strategies. It aims to quickly identify trending or ranging markets, anticipate potential reversals with breakout and crossover signals, and confirm entry and exit points to reduce false signals and improve trade accuracy.
Valoraciones de clientes
5 | 33 % | |
4 | 67 % | |
3 | 0 % | |
2 | 0 % | |
1 | 0 % |


