

present
Zarejestruj się i otrzymaj 50 $ zniżki na pierwszy zakup
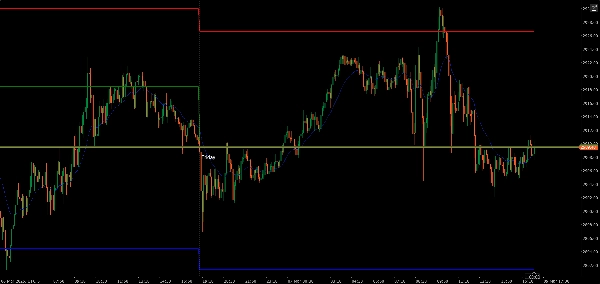
Trading product for trPDHLC Wskaźnik Indices, image 1
trPDHLC
Wskaźnik
1 zakupy
Wersja 1.0, Mar 2025
Windows, Mac
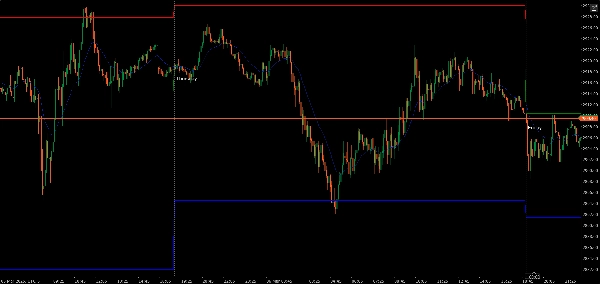
Trading product for trPDHLC Wskaźnik Indices, image 2
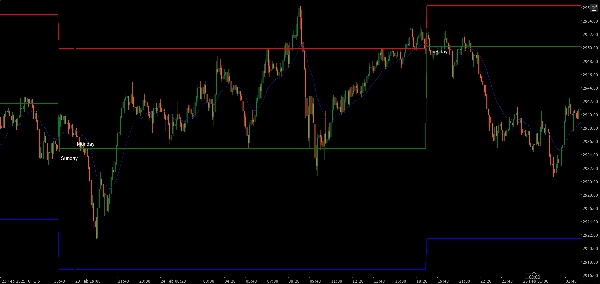
Trading product for trPDHLC Wskaźnik Indices, image 3
Trading product for trPDHLC Wskaźnik Indices, image 4
Od 08/03/2025
1
Sprzedaż

Opis

wskaźnik poprzedniego dnia: maksimum, minimum i zamknięcie.

niebieska linia pokazuje minimum poprzedniego dnia.

czerwona linia pokazuje maksimum poprzedniego dnia.

zielona linia pokazuje zamknięcie poprzedniego dnia.

Podsumowanie

Podsumowanie AI
The trPDHLC indicator displays the previous day's high, low, and closing prices on a trading chart. It uses color-coded lines for clear visualization: a red line marks the previous day's high, a blue line indicates the previous day's low, and a green line shows the previous day's closing price. This tool helps traders quickly reference key price levels from the prior trading day, aiding in technical analysis and decision-making. The indicator is tagged for use with indices markets.
Profil wskaźnika

Opinie klientów

0.0
Opinie: 0
Opinie klientów
Ten produkt nie ma jeszcze opinii. Wypróbowałeś(-aś) go już? Bądź pierwszy(-a) i powiedz o tym innym!

Dyskusja

Częste pytania

Indices
Produkty dostępne za pośrednictwem cTrader Store, w tym boty handlowe, wskaźniki i wtyczki, dostarczane są przez deweloperów zewnętrznych i udostępniane wyłącznie w celach informacyjnych oraz w celu zapewnienia dostępu technicznego. cTrader Store nie jest brokerem i nie zapewnia doradztwa inwestycyjnego, nie udziela spersonalizowanych rekomendacji ani nie gwarantuje przyszłych wyników.

Więcej od tego autora
Wskaźnik
daily period separate indicator.

Możesz także polubić

Wskaźnik
MCDX is a powerful and innovative indicator.
Wskaźnik
EMA
A visual signal backtester that simulates trades directly on your chart and scores strategy performance.
Wskaźnik
AI
ATR
+27
Nadaraya-Watson Envelope Indicator
Wskaźnik
Volume
Key Levels
+4
Margin Zones its CME-based support/resistance levels from price extremes, helps traders spot entries and exits NKZ zones
Wskaźnik
Parabolic SAR Alert - Trend reversal alerts with smart signals & custom alerts.
Wskaźnik
ATR
BOS
+5
Full ICT/SMC 4-step setup checker that alerts a long or short setup.
Wskaźnik
AI
ATR
+27
Supertrend Indicator
Wskaźnik
Prop
Forex
+5
Higher TimeFrame Candle Tracker: Current Timeframe (Any TimeFrame) Show High TimeFrame Candle Bar
Wskaźnik
EMA
RSI
+5
MACD Colour Histogram with 11 Moving Average Types, Multi-timeframe confirmation and Sound Signal Alert.
Wskaźnik
Volume
Key Levels
+5
Volume Profile Pro - A Lightweight and Highly Customizable Volume Profile
Wskaźnik
RSI
Key Levels
+3
MARCs Multi-timeframe market dashboard with trend rows, RSI context, sessions, presets and optional chart levels.
Wskaźnik
Triangle
Double Top
+5
Know which liquidity sweeps are real. Auto-tracks EQH/EQL and confirms genuine reversals, not just broken levels.
Wskaźnik
Prop
Forex
+14
Automatically plots Fibonacci retracement levels using the highest and lowest points of a customizable time range
Wskaźnik
BOS
CHOCH
+5
Smart Money Concepts Automate your institutional analysis and make decisions with pinpoint precision..
Logo „Boris Indicator”
Najwyżej oceniane
4.6
(5)
$19
/
$28
Wskaźnik
AI
Grid
+17
BORIS Easy Trend: Relax & scalp with 6-TF alignment. Clear BUY/SELL signals & movable UI/HUD make trading effortless.
Wskaźnik
AI
RSI
+18
Session boxes with UTC offset, OR logic, adjustable opacity, and multi-day lookback.
Wskaźnik
Pin Bar
Inducement
+5
Institutional Nasdaq Session Liquidity Map with Live Point HUD, Sweep Alerts & Interactive Playbook.
Wskaźnik
Market Structure
Stop guessing which trading session you in, with Sessions indicator sessions are in your finger tips like a pro

Cena

Od 08/03/2025
1
Sprzedaż
















