Opis
TDI Signal Pro – Zaawansowany wskaźnik zmienności RSI
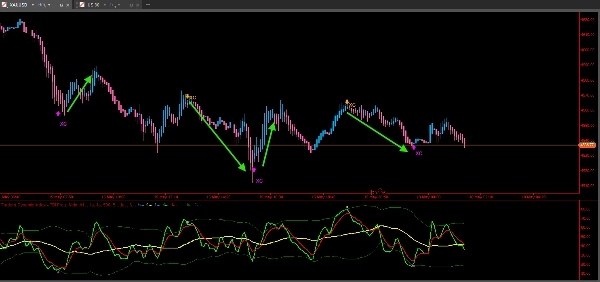
TDI Signal Pro to wielofunkcyjny wskaźnik oparty na RSI, zbudowany w oparciu o metodologię Traders Dynamic Index. Łączy analizę pasm zmienności z trzema niezależnymi systemami wykrywania sygnałów, nakładką RSI na wielu interwałach czasowych, wykrywaniem dywergencji oraz konfigurowalnym systemem alertów — wszystko w jednym wskaźniku z sygnałami wyświetlanymi bezpośrednio na wykresie cenowym.
────────────────────────
Inne wskaźniki premium dostępne w sklepie cTrader:
- Quantum Flow – Adaptacyjny silnik momentum oparty na percentylach z potwierdzeniem MTF https://ctrader.com/products/4330
- SmartArrows AI V2 – Wskaźnik sygnałów dla wykresów Renko z analizą MTF https://ctrader.com/products/1797
- VoltyPulse – Wielomodełowy system sygnałów technicznych z 3 niezależnymi warstwami filtrów https://ctrader.com/products/4233
- TDI Signal Pro – Zaawansowany silnik TDI z sygnałami Shark Fin, Extreme Cross i Dywergencją https://ctrader.com/products/4343
- PipMiner – Wskaźnik walidacji momentum i trendu MACD z naciskiem na precyzję https://ctrader.com/products/4242
- Elliot Wave Impulse Pro – Automatyczne wykrywanie fal Elliotta z profesjonalnymi filtrami https://ctrader.com/products/3221
────────────────────────
SYSTEMY SYGNAŁÓW
──────────────
Shark Fin
Wykrywa moment, gdy linia cenowa RSI wychodzi poza pasma zmienności, a następnie wraca do środka, przecinając w tym czasie linię sygnału handlowego. Konfigurowalne filtry obejmują minimalną odległość odwrócenia, ekstremalne poziomy RSI oraz kierunek nachylenia pasma. Zaprojektowany do identyfikacji warunków nadmiernego rozciągnięcia, po których następuje zmiana momentum.
Extreme Cross
Aktywuje się, gdy linia cenowa RSI przecina z powrotem wewnątrz pasma zmienności po spędzeniu czasu w strefie ekstremalnej (poniżej poziomu kupna lub powyżej poziomu sprzedaży). Potwierdzenie wstecz zapewnia, że RSI faktycznie był rozciągnięty przed zaliczeniem przecięcia.
Dywergencja
Identyfikuje klasyczną dywergencję RSI: cena tworzy niższy dołek, podczas gdy RSI tworzy wyższy dołek (bycza), lub cena tworzy wyższy szczyt, podczas gdy RSI tworzy niższy szczyt (niedźwiedzia). Aktywna tylko w odpowiedniej strefie RSI, aby ograniczyć szumy.
PROJEKCJA NA WYKRESIE
────────────────
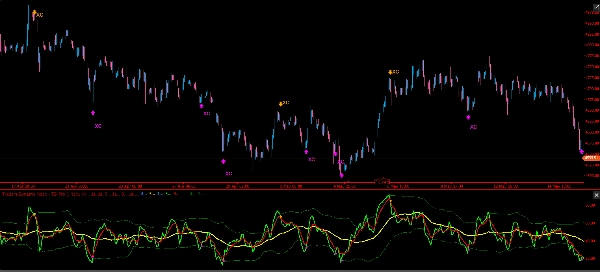
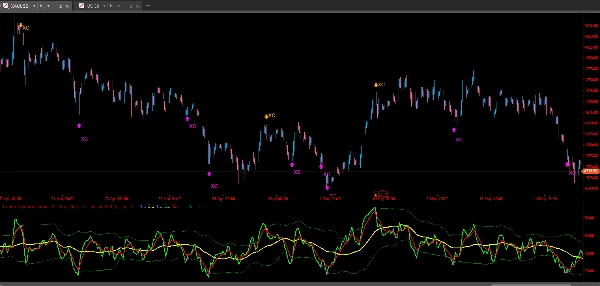
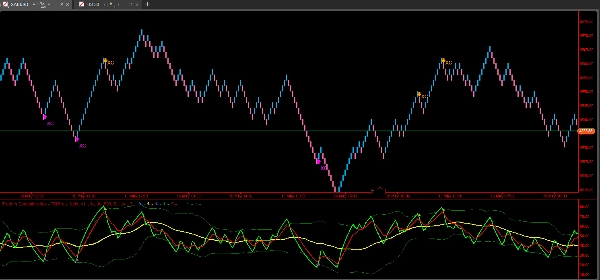
Wszystkie sygnały są rysowane bezpośrednio na wykresie cenowym jako strzałki (ikony w górę/w dół) z krótkimi etykietami typu (SF, XC, DIV). Umiejscowienie strzałek wykorzystuje dynamiczny offset oparty na własnym zakresie high-low świecy, który automatycznie skaluje się na różnych interwałach od M1 do D1 bez ręcznej regulacji. Strzałki na wykresie są ograniczone do ostatnich 200 świec, aby utrzymać wydajność wykresu.
RSI NA WIELU INTERWAŁACH CZASOWYCH
───────────────────
Opcjonalna linia RSI z wyższego interwału czasowego może być nałożona w panelu wskaźnika. Interwał jest dowolnie wybieralny. Pozwala to na potwierdzenie kierunku sygnału w szerszym kontekście rynkowym bez zmiany wykresów.
SYSTEM ALERTÓW
────────────
Trzy niezależne opcje alertów, każda z przełącznikiem włącz/wyłącz:
- Log Output: zapisuje szczegóły sygnału do logu cTrader
- Sound Alert: odtwarza dźwięk powiadomienia systemowego przy sygnale
Alerty uruchamiają się raz na zamkniętą świecę.
PARAMETRY
──────────
Wszystkie główne funkcje mają przełączniki włącz/wyłącz w panelu ustawień, zorganizowane w wyraźnie oznaczone sekcje:
- Multi-Timeframe (włącz / wybór interwału)
- Strzałki na wykresie (pokazuj sygnały na wykresie / pokazuj etykiety / offset strzałki / okno historii)
- Wypełnienie pasma (włącz/wyłącz)
- Offset kropki sygnału (pozycjonowanie kropki w panelu RSI)
- Shark Fin (wszystkie parametry filtrów)
- Extreme Cross (poziomy i lookback)
- Dywergencja (włącz/wyłącz, lookback, minimalna różnica RSI)
- Alerty (log / dźwięk / wyskakujące okienko na wykresie, każdy niezależnie przełączany)
ZASTRZEŻENIE
──────────
Ten wskaźnik jest narzędziem analizy technicznej. Wzorce sygnałów z przeszłości nie gwarantują wyników w przyszłości. Wszystkie decyzje handlowe pozostają wyłączną odpowiedzialnością użytkownika. Ten produkt nie stanowi porady inwestycyjnej.
Podsumowanie
The indicator projects signals directly onto the price chart as arrows with labels, dynamically scaled across timeframes from 1 minute to daily, with a history window of up to 200 bars. It supports an optional multi-timeframe RSI overlay for broader market context confirmation without changing charts. The alert system offers configurable log output, sound notifications, and on-chart popups, each independently toggleable and triggered once per closed bar.
All major features and parameters, including multi-timeframe settings, chart arrow display, band fill, signal filters, and alert options, are configurable via a structured settings panel. This tool is designed for trend and volatility analysis using RSI-based signals.
Dyskusja
Opinie klientów
5 | 80 % | |
4 | 20 % | |
3 | 0 % | |
2 | 0 % | |
1 | 0 % |