
HLC_Levels
Wskaźnik
4 zakupy
Wersja 1.0, Feb 2026
Windows, Mac
4.3
Opinie: 3
Opis
Opis:
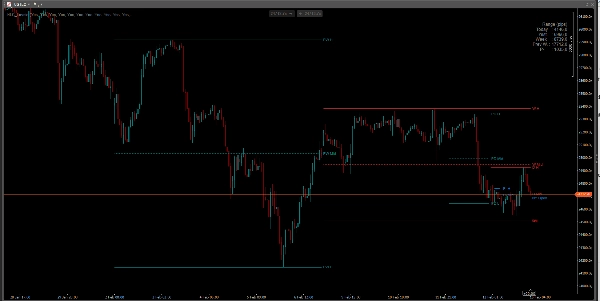
Przestań codziennie ręcznie rysować linie. Zaawansowane poziomy HLC i sesji to kompleksowy wskaźnik zaprojektowany dla profesjonalnych traderów, którzy polegają na instytucjonalnych punktach odniesienia. Niezależnie od tego, czy handlujesz Price Action, koncepcjami ICT, czy strategiami Breakout, to narzędzie utrzymuje Twój wykres czysty, a poziomy precyzyjne.
Kluczowe cechy:
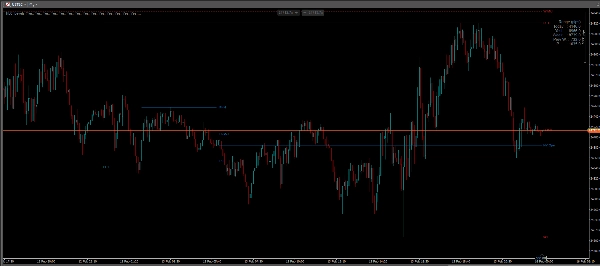
- Poziomy dzienne: Automatycznie wyświetla dzisiejsze i wczorajsze poziomy High, Low oraz Mid (50%).
- Poziomy tygodniowe: Wizualizuje aktualne i poprzednie tygodniowe poziomy High, Low oraz Mid.
- Otwarcie NY o północy: Dedykowany przełącznik dla instytucjonalnego poziomu cenowego Nowego Jorku o 00:00 (prawdziwe otwarcie dnia), kluczowy dla kierunkowego nastawienia.
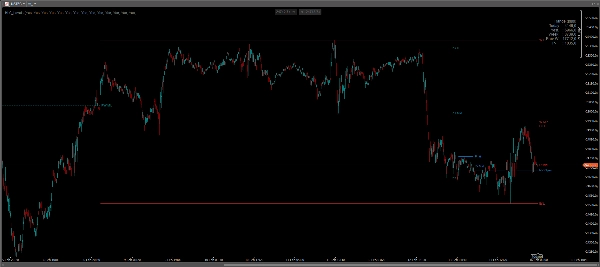
- Niestandardowy zakres / sesja: Zdefiniuj własne okno czasowe (np. sesja azjatycka, otwarcie Londynu lub Initial Balance). Wskaźnik narysuje High, Low i Mid dla tego konkretnego okresu.
- Panel zmienności: Tabela na wykresie pokazująca zakres pipsów (High minus Low) dla dnia, wczoraj, tygodnia, poprzedniego tygodnia oraz Twojego niestandardowego zakresu.
- Inteligencja stref czasowych: Działa z czasem brokera, UTC, NY lub lokalnym, aby zapewnić zgodność poziomów z Twoją strategią.
Dlaczego warto używać tego wskaźnika?
- Punkty reakcji: Stare maksima/minima i punkty środkowe często działają jako silne wsparcie i opór.
- Mid (równowaga): Poziom 50% jest kluczowy do identyfikacji cen "zniżkowych" vs "premium".
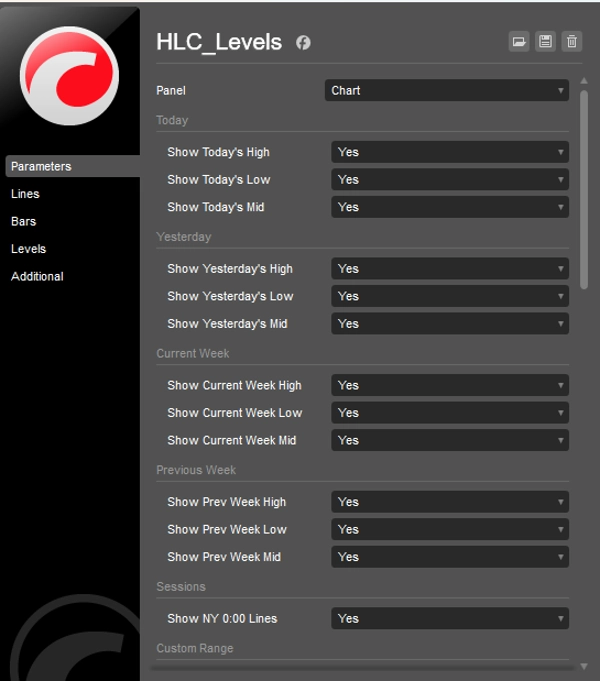
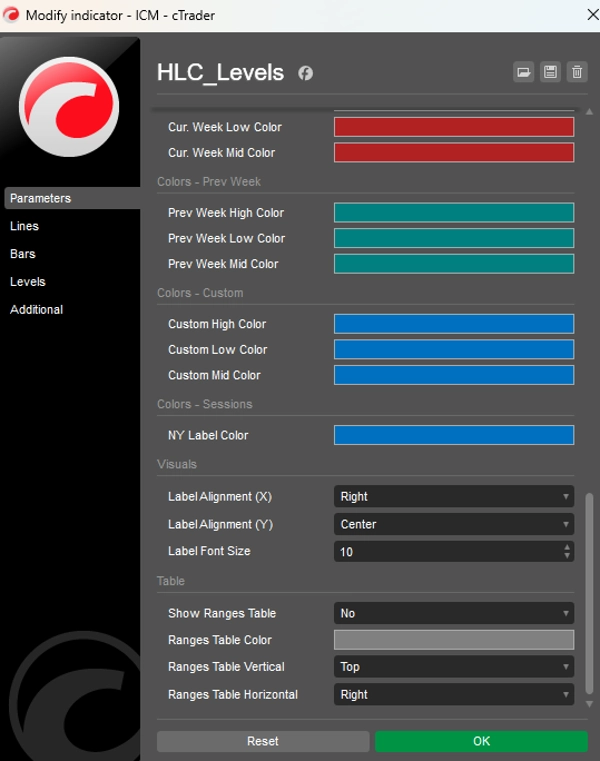
- W pełni konfigurowalny: Włączaj/wyłącz dowolne linie. Zmieniaj kolory, style linii i pozycje etykiet, aby dopasować do swojego szablonu.
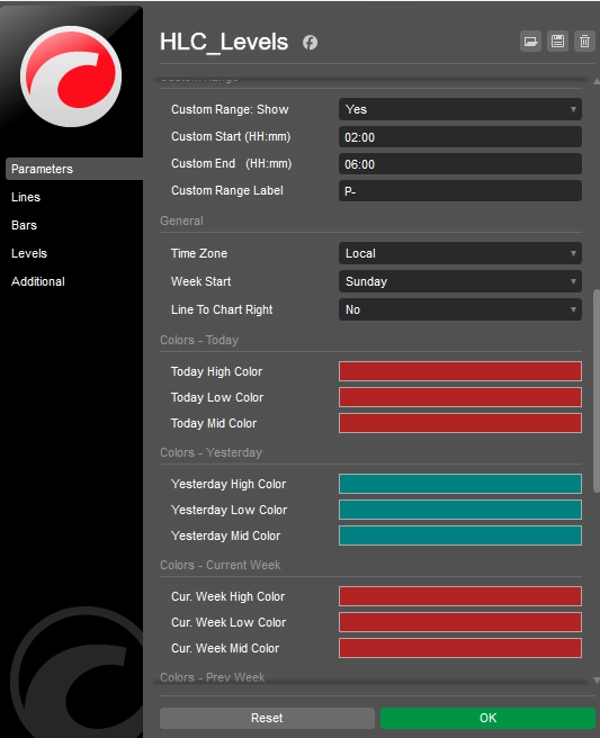
Ustawienia:
- Włącz/wyłącz konkretne ramy czasowe (Dzisiaj, Wczoraj, Tydzień, Poprzedni tydzień).
- Niestandardowe czasy rozpoczęcia/zakończenia dla określonych zakresów sesji.
- Opcja "Rozszerz linie" do projekcji poziomów w przyszłość.
- Niestandardowe kolory dla każdej grupy linii.
Podsumowanie
Profil wskaźnika
Opinie klientów
4.3
Opinie: 3
5 | 33 % | |
4 | 67 % | |
3 | 0 % | |
2 | 0 % | |
1 | 0 % |
Opinie klientów
May 16, 2026
Bit weird to see there is no Close level eventhough it's called HLC_levels.. There is a high and low and a mid, but no close. I kinda find it essential to have a close though. Other than that is safes me huge amount of time daily to not set all these levels manually. So besides the lack of the close level i still like this indicator. Would love to see a new version with the added close level as the name suggests
March 2, 2026
A 5 minute check should not become a 30 minute rabbit hole, and the entry needs one more reason to make sense.
February 21, 2026
most of the value comes from the decision gets a little more breathing room. The market context still matters.
Dyskusja
Częste pytania
Prop
Forex
Scalping
Indices
SMC
AI
XAUUSD
NAS100
USDJPY
Produkty dostępne za pośrednictwem cTrader Store, w tym boty handlowe, wskaźniki i wtyczki, dostarczane są przez deweloperów zewnętrznych i udostępniane wyłącznie w celach informacyjnych oraz w celu zapewnienia dostępu technicznego. cTrader Store nie jest brokerem i nie zapewnia doradztwa inwestycyjnego, nie udziela spersonalizowanych rekomendacji ani nie gwarantuje przyszłych wyników.


![Logo „High-Low Divergence [Iridio Capital]”](https://cdn.ctrader.com/image/webp/443c4661-7abb-40f1-842f-4b6ec560649b_40914)


Cena
24
Sprzedaż
665
Bezpłatne instalacje