
EMA Trend Simple
Wskaźnik
294 pobrania
Wersja 1.1, May 2026
Windows, Mac
Opis
W przeciwieństwie do standardowych wskaźników, to narzędzie posiada Inteligentny Sygnał Na Żywo: na aktualnie formującej się świecy, strzałka sygnału "miga", aby wskazać potencjalne przecięcie. Zapobiega to fałszywym wejściom, ostrzegając, że sygnał nie jest jeszcze potwierdzony, dopóki świeca się nie zamknie.
Dedykowane do półautomatycznego handlu z https://ctrader.com/products/3618?u=cLogic
Kluczowe cechy:
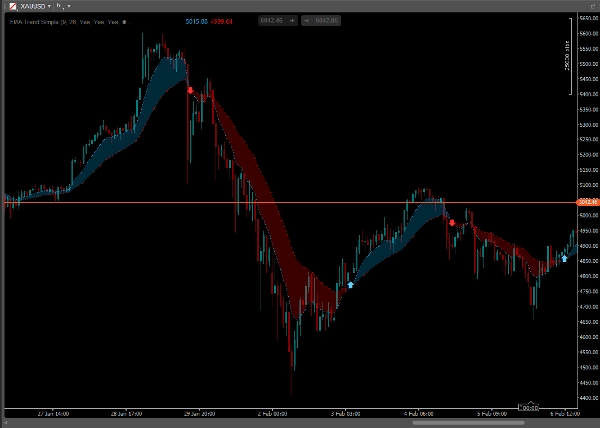
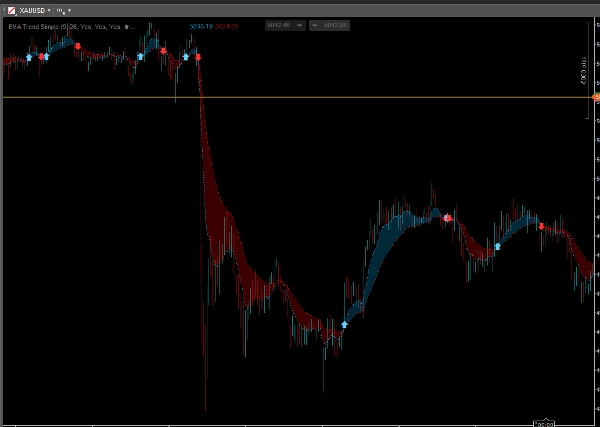
- ☁️ Chmura Trendu: Automatycznie wypełnia przestrzeń między szybką a wolną EMA przezroczystą chmurą.
-
- Niebieska Chmura: Trend wzrostowy (Szybka EMA > Wolna EMA).
- Czerwona Chmura: Trend spadkowy (Szybka EMA < Wolna EMA).
- 🏹 Sygnały Przecięcia: Wyświetla konfigurowalne strzałki dokładnie w momencie zmiany trendu.
- ⚠️ Inteligentna logika "Migania": Na aktywnym (ostatnim) słupku strzałka miga, jeśli przecięcie dzieje się w czasie rzeczywistym. Pomaga to monitorować zmienność rynku bez wprowadzania w błąd przez niepotwierdzone sygnały. Po zamknięciu świecy sygnał staje się trwały (nieprzemalowujący).
- 🎨 W pełni konfigurowalny:
-
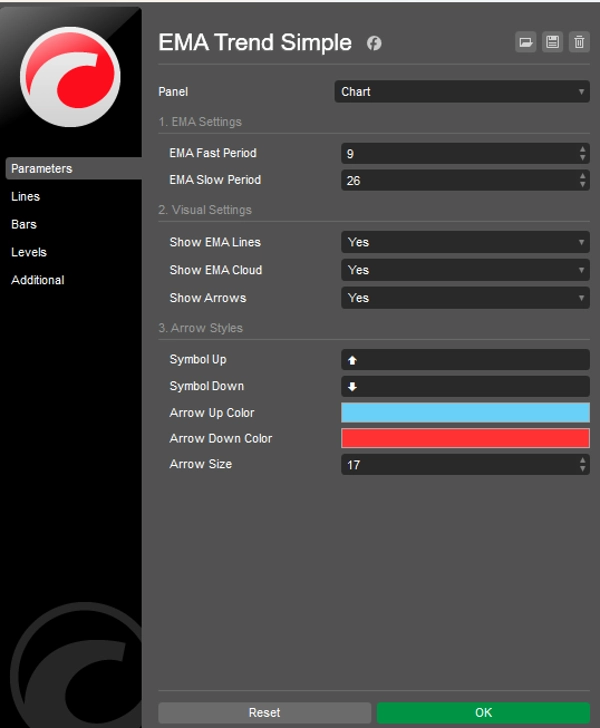
- Zmień okresy EMA (Szybka/Wolna).
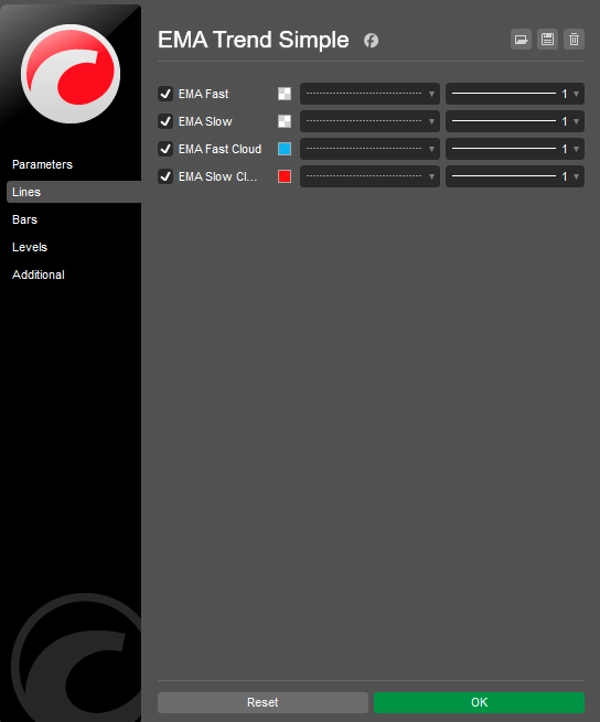
- Włącz/wyłącz linie, chmurę lub strzałki niezależnie.
- Dostosuj symbole strzałek (używając tekstu/unicode), kolory i rozmiary.
Jak to czytać:
- Sygnał kupna: Chmura staje się niebieska, a pojawia się strzałka w górę.
- Sygnał sprzedaży: Chmura staje się czerwona, a pojawia się strzałka w dół.
- Czekaj: Jeśli strzałka miga, świeca jeszcze się nie zamknęła – poczekaj na zamknięcie, aby potwierdzić sygnał.
Parametry:
- Ustawienia EMA: Ustaw preferowane okresy (Domyślnie: 9 & 26).
- Wygląd: Włącz/wyłącz chmurę, linie lub strzałki, aby utrzymać wykres w czystości.
- Stylizacja: Wybierz własne kolory i kształty strzałek.
Podsumowanie
Podsumowanie AI
EMA Trend Simple is a trend-following indicator designed for clarity and ease of use. It visually represents market trends by filling the area between two exponential moving averages (EMAs) with a transparent cloud: blue for uptrends (fast EMA above slow EMA) and red for downtrends (fast EMA below slow EMA). The indicator provides crossover signals with customizable arrows that appear precisely when the trend changes.
A distinctive feature is the Smart Live Signal: on the current forming candle, the signal arrow blinks to indicate a potential crossover, helping traders avoid false entries by waiting for candle close confirmation. Once confirmed, signals become permanent and non-repainting.
Users can fully customize EMA periods, toggle visibility of lines, clouds, and arrows independently, and adjust arrow symbols, colors, and sizes. The indicator supports semi-automatic trading integration.
To interpret signals: a blue cloud with an up arrow suggests a buy, a red cloud with a down arrow suggests a sell, and blinking arrows indicate unconfirmed signals pending candle closure.
EMA Trend Simple is applicable across various markets including Forex, cryptocurrencies, and commodities, supporting trend analysis and scalping strategies. It requires bar data input and outputs visual trend signals and crossover alerts.
Profil wskaźnika
Kategoria wskaźnika
Trend
Typ wyjścia
Wizualizacja
Sygnały
Wymagania dotyczące danych
Tylko słupki
Obsługiwane sygnały
Przecięcie
Opinie klientów
0.0
Opinie: 0
Opinie klientów
Ten produkt nie ma jeszcze opinii. Wypróbowałeś(-aś) go już? Bądź pierwszy(-a) i powiedz o tym innym!
Dyskusja
Częste pytania
BTCUSD
Prop
Forex
Scalping
EURUSD
Supertrend
Crypto
AI
XAUUSD
USDJPY
Produkty dostępne za pośrednictwem cTrader Store, w tym boty handlowe, wskaźniki i wtyczki, dostarczane są przez deweloperów zewnętrznych i udostępniane wyłącznie w celach informacyjnych oraz w celu zapewnienia dostępu technicznego. cTrader Store nie jest brokerem i nie zapewnia doradztwa inwestycyjnego, nie udziela spersonalizowanych rekomendacji ani nie gwarantuje przyszłych wyników.


Cena
24
Sprzedaż
664
Bezpłatne instalacje