
说明
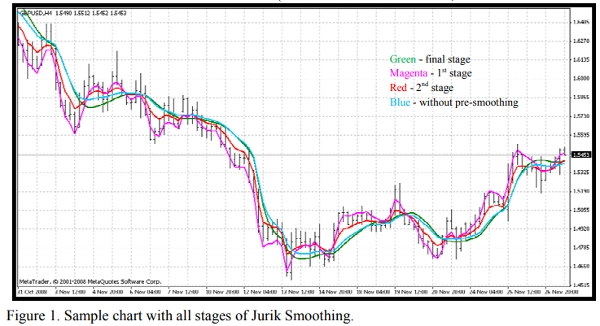
Jurik 平滑包括 3 个阶段:
第 1 阶段 - 通过自适应 EMA 的初步平滑:MA1 = (1-alpha)*Price + alpha*MA1[1];
第 2 阶段 - 通过卡尔曼滤波器进行另一次初步平滑:Det0 = (Price - MA1)*(1-beta) + beta*Det0[1]; MA2 = MA1 + PR*Det0;
第 3 阶段 - 通过独特的 Jurik 自适应滤波器进行最终平滑:Det1 = (MA2 - JMA[1]) * (1-alpha)^2 + alpha^2 * Det1[1]; JMA = JMA[1] + Det1;
其中:- Price - 价格序列 - alpha - 动态因子(将在下文描述) - beta - 周期比率 = 0.45*(Length-1)/(0.45*(Length-1)+2) - PR - 相位比率:PR = Phase/100 + 1.5(如果 Phase < -100 则 PR=0.5,如果 Phase > 100 则 PR=2.5)。
图 1. 包含 Jurik 平滑所有阶段的示例图表。您可以通过附带的指标 JurikFilter_v2 看到每个阶段的结果(图 1),通过更改 FilterMode:0 - 最终阶段(JMA) 1 - 第 1 阶段 2 - 第 2 阶段 3 - 仅最终(无初步)平滑。
动态因子是周期因子(beta)提升到幂(pow):
alpha = beta ^ Pow,
其中:- pow = rVolty ^ pow1 - rVolty - 相对价格波动率 - pow1 - 相对波动率的幂,计算公式如下:pow1 = len1 - 2(如果 pow1 < 0.5 则 pow1 = 0.5),
其中 len1 - 额外的周期因子:len1 = Log(SquareRoot(len))/Log(2.0) + 2(如果 len1 < 0 则 len1 = 0)。
因此,您可以看到动态因子基于相对价格波动率,为这种价格滤波器提供了所需的适应性。
相对价格波动率的公式为 rVolty = Volty/AvgVolty(如果 rVolty > len1^(1/pow1) 则 rVolty = len1^(1/pow1),如果 rVolty < 1 则 rVolty = 1),
其中:
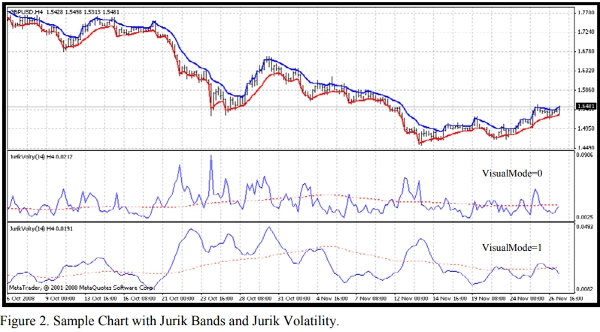
- Volty - 基于所谓 Jurik 波段计算的价格波动率(VisualMode = 1)。
- AvgVolty - Jurik 使用相当复杂的计算算法得到的平均波动率:AvgVolty = Average(vSum,AvgLen),
其中:
- vSum - (Volty - Volty[10])/10 的增量和;
- AvgLen - 平均周期(Jurik 使用 65)。
在我的 Jurik 滤波器版本中,我使用简单平均代替了 Jurik 的复杂平均。
此外,通过附带的指标 JurikVolty_v1(图 2),您可以看到 Volty(VisualMode=0)、vSum(VisualMode=1)和 AvgVolty(红色虚线)的数值。
价格波动率的公式为 Volty = Abs(del1) 和 Abs(del2) 中的较大值,如果 Abs(del1) = Abs(del2) 则 Volty = 0,
其中:- del1 - 价格与上轨的距离 del1 = Price - UpperBand - del2 - 价格与下轨的距离 del2 = Price - LowerBand Jurik 波段不同于任何已知的价格波段,如布林带、肯特纳带、多恩奇安带、分形等:如果 del1 > 0 则 UpperBand = Price 否则 UpperBand = Price - Kv*del1 如果 del2 < 0 则 LowerBand = Price 否则 LowerBand = Price - Kv*del2,
其中:- Kv - 波动率因子 Kv = bet ^ SquareRoot(pow2)。很容易看出,这些波段可以作为趋势跟踪指标的基础,如 Wilder 的抛物线指标。因此,您可以看到我们在 Jurik 移动平均线(JMA)的算法中几乎没有模糊的地方
摘要
客户评价
5 | 0 % | |
4 | 100 % | |
3 | 0 % | |
2 | 0 % | |
1 | 0 % |


