
Deskripsi
Sero — Osilator Momentum
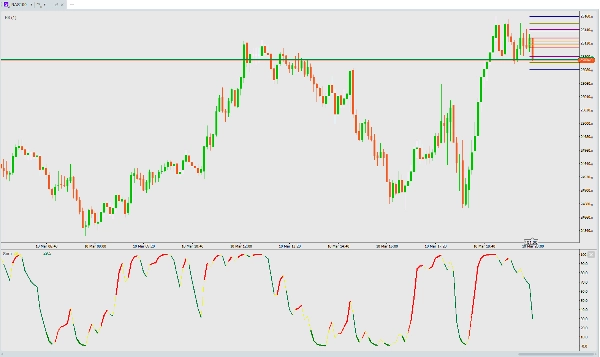
Sero adalah osilator momentum berbasis stokastik yang memberikan sinyal visual berwarna jelas untuk pergeseran momentum pasar.
Cara Kerja
Sero menghitung nilai stokastik yang dihaluskan dari Harga Tipikal (Tinggi+Rendah+Tutup)/3 selama rentang 15 bar, kemudian menerapkan EMA cepat 2-periode untuk menghasilkan osilator responsif 0–100.
Apa yang Harus Diperhatikan
Warna menceritakan kisah:
- Garis Kuning — nilai dasar Sero (selalu terlihat)
- Garis Merah — momentum bullish (Sero sedang naik)
- Garis Merah Tebal — momentum bullish kuat (naik + di atas 20 — mengonfirmasi breakout dari kondisi oversold)
- Garis Hijau — momentum bearish (Sero sedang turun)
- Garis Hijau Tebal — penurunan bearish kuat (turun + di bawah 20 — sangat dalam wilayah oversold)
Sinyal utama:
- Sinyal beli — Warna berubah dari Hijau ke Merah, terutama dari bawah 20 (pembalikan oversold)
- Sinyal jual — Warna berubah dari Merah ke Hijau, terutama dari atas 80 (pembalikan overbought)
- Tren kuat — Garis tebal mengonfirmasi keyakinan momentum
- Kelelahan — Garis Hijau Tebal di bawah 20 = penjual mungkin kehabisan tenaga, waspadai pembalikan
Praktik Terbaik
- Bekerja pada semua kerangka waktu dan semua instrumen
- Gabungkan dengan aksi harga atau level support/resistance untuk konfirmasi
- Transisi warna di dekat ekstrem (0 atau 100) adalah sinyal dengan probabilitas tertinggi
- Tidak perlu pengaturan — sudah dioptimalkan dan siap digunakan langsung
Ringkasan
Ringkasan AI
Sero is a stochastic-based momentum oscillator designed to identify market momentum shifts through clear, color-coded visual signals. It calculates a smoothed stochastic value from the Typical Price [(High + Low + Close) / 3] over a 15-bar range, then applies a fast 2-period exponential moving average (EMA) to generate a responsive oscillator ranging from 0 to 100.
The indicator displays multiple colored lines to represent momentum states:
- Yellow line: base Sero value (always visible)
- Red line: bullish momentum (rising oscillator)
- Thick red line: strong bullish momentum (rising and above 20, indicating breakout from oversold)
- Green line: bearish momentum (falling oscillator)
- Thick green line: strong bearish momentum (falling and below 20, indicating deep oversold conditions)
Key signals include buy signals when the color flips from green to red, especially below 20 (oversold reversal), and sell signals when it flips from red to green, especially above 80 (overbought reversal). Thick lines confirm strong momentum trends, while thick green lines below 20 may indicate exhaustion of selling pressure and potential reversal.
Sero works on any timeframe and instrument without requiring user settings, and it is recommended to combine it with price action or support/resistance levels for confirmation. Color transitions near extremes (0 or 100) provide the highest-probability signals.
Profil indikator
Ulasan pelanggan
0.0
Ulasan: 0
Ulasan pelanggan
Belum ada ulasan untuk produk ini. Sudah mencobanya? Jadilah pemberi ulasan pertama!
Diskusi
Pertanyaan umum
BTCUSD
Forex
Signal
Indices
EURUSD
Commodities
GBPUSD
NZDUSD
Crypto
Stocks
XAUUSD
NAS100
USDJPY
Produk-produk yang tersedia melalui cTrader Store, termasuk bot trading, indikator, dan plugin, disediakan oleh pengembang pihak ketiga serta hanya ditujukan untuk akses teknis dan informasi. cTrader Store bukan broker dan tidak menyediakan saran investasi, rekomendasi pribadi, atau jaminan apa pun tentang kinerja di masa mendatang.
Produk lain dari penulis ini


![Logo "[Hamster-Coder] Pivot Points MTF"](https://cdn.ctrader.com/image/webp/4c143e5a-309c-40e3-a578-f04d1e133ffa_31159)


Harga
Sejak 10/03/2026
105
Instal gratis