
Deskripsi
Indikator TrendFibonacci dirancang untuk membantu trader mengidentifikasi level harga kritis dan tren pasar dengan presisi. Dengan mengintegrasikan level retracement Fibonacci dengan Weighted Moving Average (WMA) dan Average True Range (ATR), indikator ini memberikan representasi visual yang jelas tentang support, resistance, dan arah tren.
Fitur Utama:
- Level Fibonacci Dinamis: Secara otomatis menghitung dan memplot level retracement Fibonacci (default: 0.382 dan 0.618) berdasarkan harga tertinggi dan terendah selama periode lookback yang ditentukan pengguna.
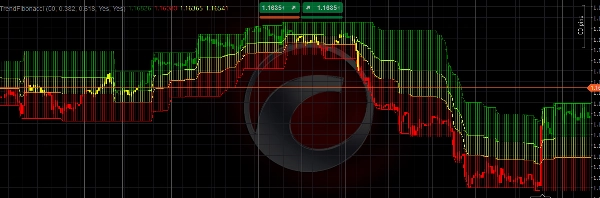
- Weighted Moving Average (WMA): Menggunakan WMA periode 6 untuk mengukur arah tren, dengan candle berwarna (Hijau untuk bullish, Merah untuk bearish, Kuning untuk netral) yang mencerminkan posisi WMA relatif terhadap level Fibonacci.
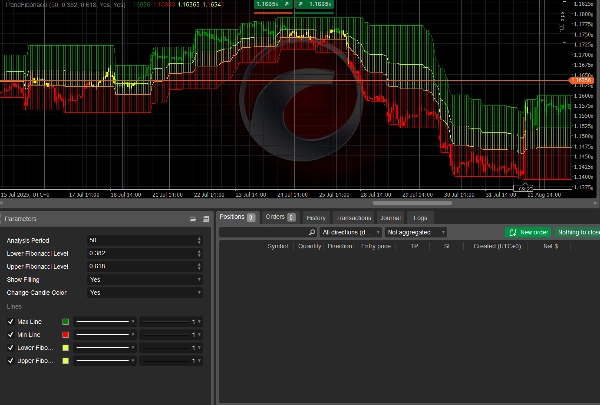
- Parameter yang Dapat Disesuaikan: Sesuaikan periode analisis, level Fibonacci, dan aktifkan fitur seperti zona terisi dan perubahan warna candle.
- Kejelasan Visual: Memplot garis high/low dan mengisi area antara level Fibonacci dengan warna semi-transparan untuk memudahkan identifikasi tren.
- Integrasi ATR: Menggabungkan ATR periode 200 untuk analisis pasar yang kuat, memastikan adaptasi terhadap volatilitas.
Indikator ini ideal untuk trader yang ingin menggabungkan analisis Fibonacci dengan strategi mengikuti tren. Baik Anda trading forex, saham, atau komoditas, TrendFibonacci meningkatkan kemampuan Anda untuk menemukan zona pembalikan kunci dan membuat keputusan trading yang tepat.
Cara Menggunakan
- Pasang Indikator:
-
- Tambahkan indikator TrendFibonacci ke platform cTrader Anda dengan mengunggah kode sumber atau mengunduhnya dari marketplace.
- Konfigurasikan Parameter:
-
- Periode Analisis: Atur periode lookback (default: 50 bar) untuk menentukan rentang perhitungan harga high/low.
- Level Fibonacci Bawah: Sesuaikan level retracement Fibonacci bawah (default: 0.382).
- Level Fibonacci Atas: Sesuaikan level retracement Fibonacci atas (default: 0.618).
- Tampilkan Pengisian: Aktifkan/nonaktifkan zona terisi antara level Fibonacci (default: aktif).
- Ubah Warna Candle: Aktifkan/nonaktifkan candle berwarna berdasarkan posisi WMA (default: aktif).
- Interpretasikan Indikator:
-
- Candle Hijau: Menunjukkan tren bullish saat WMA berada di atas level Fibonacci atas.
- Candle Merah: Menandakan tren bearish saat WMA berada di bawah level Fibonacci bawah.
- Candle Kuning: Menunjukkan zona netral saat WMA berada di antara level Fibonacci.
- Zona Terisi: Memvisualisasikan zona harga kunci antara garis high/low dan level Fibonacci untuk analisis support/resistance.
- Aplikasi Trading:
-
- Gunakan indikator untuk mengidentifikasi titik masuk/keluar potensial pada level Fibonacci.
- Gabungkan dengan alat teknikal lain (misalnya, RSI, MACD) untuk konfirmasi.
- Pantau candle berwarna untuk menilai kekuatan dan arah tren.
- Praktik Terbaik:
-
- Uji indikator pada akun demo untuk membiasakan diri dengan perilakunya.
- Sesuaikan parameter agar sesuai dengan gaya trading dan kondisi pasar Anda.
- Gunakan pada timeframe yang lebih tinggi (misalnya, H1, H4) untuk sinyal yang lebih dapat diandalkan.
Indikator TrendFibonacci adalah alat serbaguna untuk trader dari semua tingkat, menawarkan wawasan yang jelas dan dapat ditindaklanjuti tentang tren pasar dan level harga.
Ringkasan
Users can customize parameters such as the analysis period, Fibonacci levels, and visual features like filled zones between Fibonacci levels and candle color changes. The indicator visually highlights support and resistance zones by plotting high/low lines and filling areas between Fibonacci levels with semi-transparent colors. It is applicable across various markets including forex, stocks, commodities, and popular symbols like BTCUSD, EURUSD, GBPUSD, and XAUUSD.
TrendFibonacci supports traders in spotting potential entry and exit points at Fibonacci levels and can be combined with other technical tools like RSI and MACD for confirmation. It is recommended for use on higher timeframes (e.g., H1, H4) to enhance signal reliability.


![Logo "[Hamster-Coder] Pivot Points MTF"](https://cdn.ctrader.com/image/webp/4c143e5a-309c-40e3-a578-f04d1e133ffa_31159)
