
説明
注意: cTrader Windowsのみでテスト済みです。
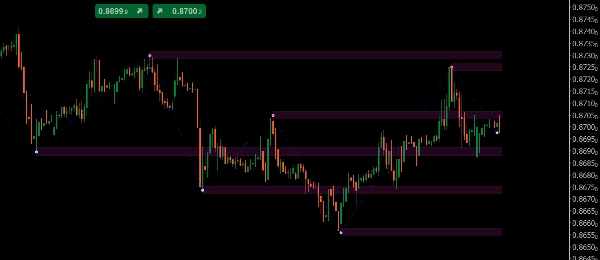
LT_Ind_SRZones はスイングの高値/安値を検出し、近接するスイングを サポート/レジスタンスゾーン に統合し、現在の価格周辺の最も関連性の高いレベルにチャートを集中させます。
描画内容
- ゾーン: 統合されたスイングから作られたシェード付きバンド
- スイング高値/安値 ポイント
- ジグザグ パスで構造を素早く読み取るため
主な操作
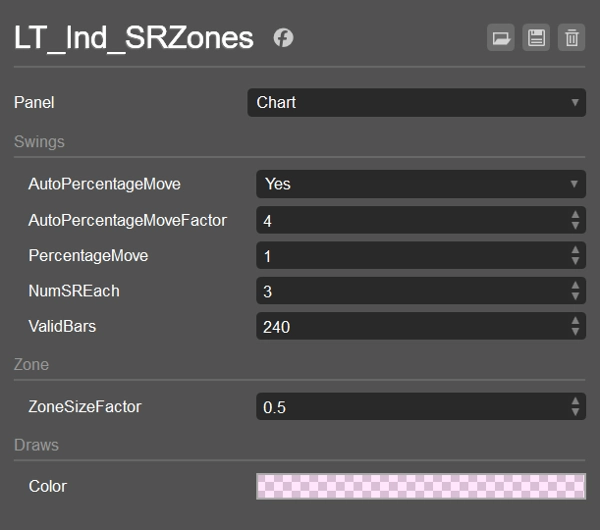
- AutoPercentageMove (bool) + AutoPercentageMoveFactor (double)
スイング感度を自動調整します。オフにすると PercentageMove を手動で使用します。 - PercentageMove (double)
Autoがオフのときにスイングを形成するための最小移動量(%)。 - ZoneSizeFactor (double)
ゾーンの高さ =ZoneSizeFactor × ATR。 - NumSREach (int)
現在の価格の 上 と 下 に保持する トップゾーン の数。 - ValidBars (int)
このバー数より古いスイングは無視します。 - 色 / 表示スタイル
ゾーンの塗りつぶし色(アルファ付き)、スイング/ジグザグのスタイル。
並び順とフィルターのロジック(ゾーンの選択方法)
- スイングを収集:最新から遡って、永久的なもののみ、かつ ValidBars より古くないもの。
- 現在の価格の 上 と 下 のスイング数をカウント(値がゾーンの半分内にあるものも含む)。両側が
NumSREachに達したら停止。 - フォールバック:片側に適格なスイングがない場合、その側に 1つ古い スイングを追加。
- マージ:各該当スイングについて、既存のゾーンに マージ(
CanMerge)するか、新しいゾーンを 作成 します。 - ランク付けと選択:
-
- 価格より上:ゾーンを (High − price) の昇順でソートし、次に MostRecentIndex の降順でソート; NumSREach を取得。
- 価格より下:ゾーンを (price − Low) の昇順でソートし、次に MostRecentIndex の降順でソート; NumSREach を取得。
- 結合:2つのリストを統合 → 最終的に表示されるゾーン。
これにより表示は すっきりと近く、最新のものに保たれ、それでいて例外的なケースにも対応します。
デフォルト設定
- AutoPercentageMove = true、AutoPercentageMoveFactor = 4
- PercentageMove = 1.0(Autoがfalseのときに使用)
- NumSREach = 1
- ValidBars = 240
- ZoneSizeFactor = 0.5(ゾーンの高さ = 0.5 × ATR)
- ゾーンの色 = #21FF33E0(半透明)
- スイング高値 = #FFFF999A、スイング安値 = #FF99DFF9、ジグザグ = 青(ドット)
使用例
- 近くの S/Rゾーン をエントリー、部分決済、またはストップにマークする
- ゾーンの反転(サポート→レジスタンスおよびその逆) を監視する
- VWAP/Pivotsと組み合わせてコンフルエンスを得る
どのシンボルと時間軸でも動作します。 軽量でライブトレードやバックテストに対応しています。
概要
AIによる概要
LT_Ind_SRZones is an indicator designed for cTrader Windows that automatically identifies and displays support and resistance zones derived from swing highs and lows. It detects swing points, merges nearby swings into shaded support/resistance zones, and highlights the most relevant levels around the current price to maintain a clear chart view. The indicator also plots swing high/low points and a ZigZag path for quick structural analysis.
Key adjustable parameters include automatic or manual swing sensitivity settings, zone size based on a factor of the Average True Range (ATR), the number of top zones to display above and below the current price, and the maximum age of swings considered. The indicator filters and ranks zones by proximity and recency, ensuring the display focuses on recent and nearby levels.
LT_Ind_SRZones works on any symbol and timeframe, supporting markets such as Forex, indices, commodities, cryptocurrencies, and stocks. It is suitable for live trading and backtesting. Typical use cases include marking nearby support/resistance zones for trade entries, stops, or partial exits, monitoring zone flips (support to resistance and vice versa), and combining with other indicators like VWAP or pivots for confluence.
インジケーターのプロフィール
カスタマーレビュー
4.6
レビュー: 3
5 | 67 % | |
4 | 33 % | |
3 | 0 % | |
2 | 0 % | |
1 | 0 % |
カスタマーレビュー
October 22, 2025
October 15, 2025
the routine feels easier to keep, but the chart still needs a human read.
ディスカッション
よくあるご質問
Prop
Forex
Indices
Commodities
Crypto
Stocks
cTrader Storeで入手可能な取引ボット、インジケーター、プラグインなどの商品は、第三者の開発者が提供するものであり、情報と技術の取得のみを目的としてご利用いただけます。cTrader Storeはブローカーではなく、投資助言や個人的な推奨を行うことも、将来のパフォーマンスを保証することもありません。


これも好きかも


![「[CB] Pivot Points Pro」ロゴ](https://cdn.ctrader.com/image/webp/43463c82-67b0-4f10-a4ba-901bba091d81_32594)


価格
登録日 25/09/2024
34
販売