
Descrizione
Nota: Testato solo su cTrader Windows.
Profilo di Volume
Un profilo verticale disegnato nel grafico dei prezzi per mostrare a quale prezzo c'è più/meno volume (interesse di trading).
L'indicatore Flexible Volume Profile
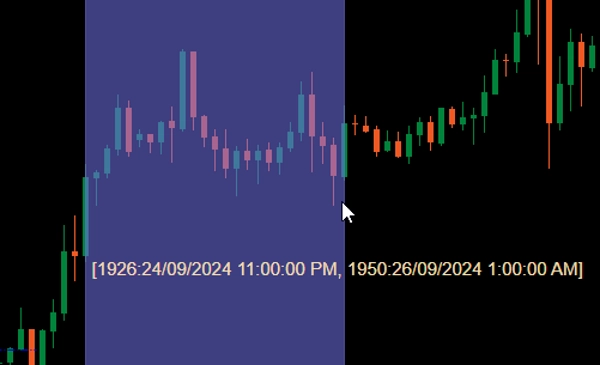
Quando aggiunto al tuo grafico, trascina con Ctrl il pulsante sinistro del mouse su un'area nel grafico dei prezzi per far disegnare il profilo per quell'area.
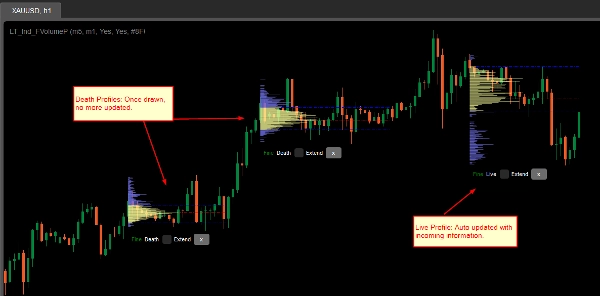
Per motivi di prestazioni, il profilo sarà disegnato in 2 stati:
- Profilo grossolano: L'indicatore utilizzerà il timeframe definito da CoarseTF (default m5) per caricare le informazioni sul volume, solitamente veloce. Mentre il profilo grossolano è mostrato, il profilo fine sarà caricato in background.
- Profilo fine: Profilo più preciso, che usa il timeframe definito da FineTF (default m1), ma puoi impostarlo al più fine (t1 - singolo tick). Tuttavia, se stai visualizzando un grafico Daily o di timeframe più lungo, impostare il timeframe a tick aumenterà il tempo di caricamento.
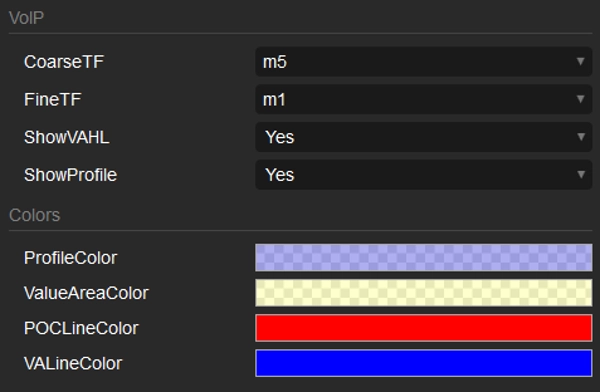
Parametri
- CoarseTF: Timeframe per i dati grossolani (default m5).
- FineTF: Timeframe per i dati fini (default m1).
- ShowVAHL: Mostra VAH (Value Area High) e VAL (Value Area Low).
- ShowProfile: Se Sì mostra il profilo completo, altrimenti mostra solo VAH, VAL e POC (Point of Control).
- Colors: Personalizzazione dei colori.
Come usare
Dopo aver aggiunto l'indicatore al tuo grafico dei prezzi, usa un trascinamento con Ctrl e pulsante sinistro del mouse per selezionare la regione nel grafico che vuoi profilare e il gioco è fatto.
Dopo che il profilo è stato disegnato, vedrai alcune informazioni/manipolazioni nella parte inferiore del profilo:
- Grossolano/Fine: stato del profilo.
- Morto/Vivo: se il tuo profilo copre l'ultima barra (candela), allora è un profilo Vivo e si aggiorna automaticamente con le informazioni in arrivo.
- Casella di controllo Estendi: seleziona per far estendere le linee VAH, VAL e POC fino all'ultima barra (candela)
- Pulsante x: Clicca per rimuovere il profilo dal grafico.
Riepilogo
Users activate the profile by holding Ctrl and dragging the mouse over a desired chart region. The indicator operates in two modes for performance optimization: a Coarse profile using a configurable timeframe (default 5 minutes) for faster loading, and a Fine profile using a finer timeframe (default 1 minute, with an option down to single ticks) for more precise volume data.
Key parameters include:
- CoarseTF and FineTF: timeframes for coarse and fine volume data aggregation.
- ShowVAHL: toggles display of Value Area High (VAH) and Value Area Low (VAL).
- ShowProfile: controls whether the full profile or only key levels (VAH, VAL, Point of Control) are shown.
- Colors: customizable color settings.
After rendering, the profile provides status indicators (Coarse/Fine, Live/Dead), options to extend VAH, VAL, and POC lines to the latest bar, and the ability to remove the profile. This tool supports detailed volume analysis to assist traders in identifying significant price levels based on traded volume.
Recensioni dei clienti
5 | 100 % | |
4 | 0 % | |
3 | 0 % | |
2 | 0 % | |
1 | 0 % |


