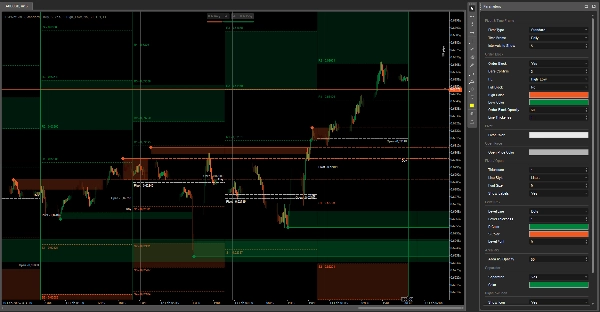
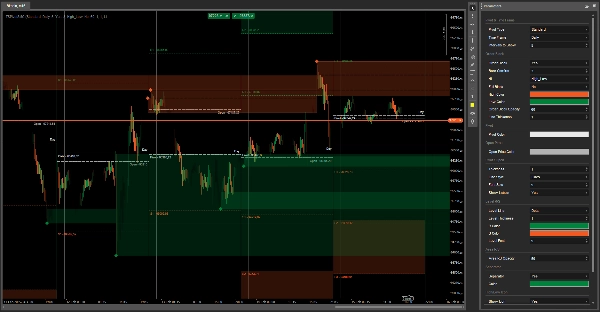
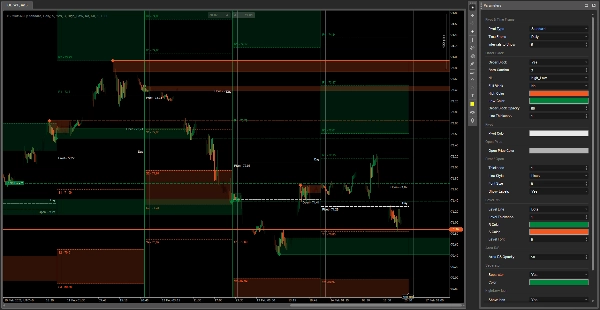
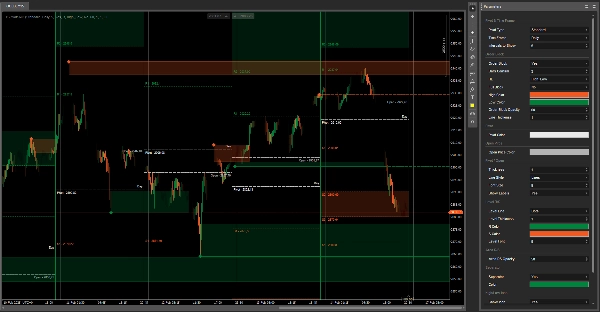
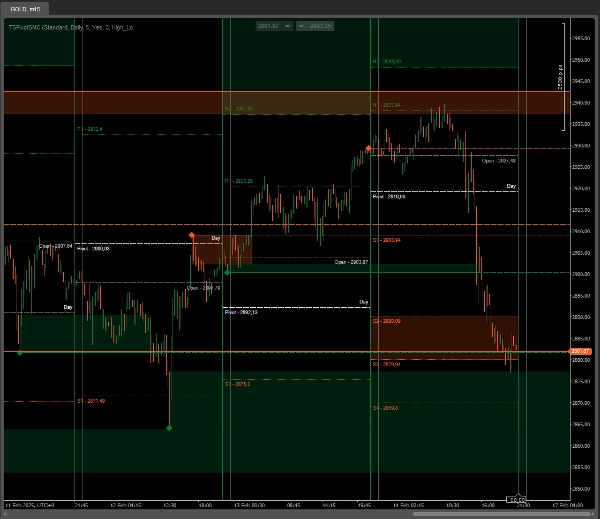
"TSPivotSMC" 标识
TSPivotSMC
4.0
评价:2
"TSPivotSMC" 已上传图片
"TSPivotSMC" 已上传图片
"TSPivotSMC" 已上传图片
"TSPivotSMC" 已上传图片
"TSPivotSMC" 已上传图片
135
销售
10.57K
免费安装

Pivot Indicator with Order Block (Smart Money Concept)

This indicator is based on the Smart Money Concept, which analyzes price behavior based on the previous session. The core idea is that price tends to repeat key patterns and movements on different timeframes, from 1 hour to 1 day.

The indicator calculates pivot, support, and resistance levels using the high, low, and closing prices of the previous session. In addition, it identifies key zones where trend changes are likely to occur, making it a useful tool for traders operating on multiple timeframes.

OrderPrice V3 https://ctrader.com/products/397

NTMPICLL https://ctrader.com/products/327

Range Box Level https://ctrader.com/products/245

Or RangeBoxFibonacci https://ctrader.com/products/526

Market Session https://ctrader.com/products/94

MacdVolume https://ctrader.com/products/267

4MA https://ctrader.com/products/247


Good luck 😀

指标配置文件
4.0
评价:2
5
50 %
4
0 %
3
50 %
2
0 %
1
0 %
客户评价
August 30, 2025
Combines Pivot Points with SMC, customizable, reliable.can clutter charts on lower TFs and lacks alerts or MTF functionality.
June 18, 2025
Hello. I try to install this indicator, and the platform do not allow me to install it, because it say it.s not a legitim source. Can be done something whit that? Or refund my money
Prop
Forex
Signal
Breakout
Scalping
Indices
Commodities
Crypto
Grid
Stocks
AI
cTrader Store 提供的所有产品,包括交易机器人、指标和插件,均由第三方开发者提供,仅供信息参考和技术访问之用。cTrader Store 并非经纪商,不提供投资建议、个人推荐或任何未来业绩保证。

该作者的其他作品

VWAP only timeframe
😎Read the description before purchasing💩
This indicator consists of 3 moving averages that can be configured to your liking, from the type of moving average....
This technical analysis indicator provides information on market sentiment, trend and price levels....
This bot can automatically generate buy and sell orders based on three specific Fixed bugs.
😎Read the description before purchasing💩
🔍 Discover All Candlestick Patterns… Absolutely Free!
With this Fibonacci retracement indicator, traders have full control over the retracement levels displayed on the chart.
Session One is a tool for marking from to, useful if you've set the hours you want to trade
A straightforward yet effective tool signals entry points for both buying and selling. Include 3 Moving Average
The Parabolic SAR, or "Stop and Reverse," is a dynamic technical analysis tool.
🚀 HAI QUANTUM v4.0 | The Ultimate Quantum Terminal for cTrader (Smart Money & Algorithmic Trading)

猜您喜欢

Automatically identify and visualize Fair Value Gaps (FVGs) with entry zones, fill tracking, and customizable alerts.
TrendMomentumScore_558: all-in-one EMA, MACD & RSI trend strength meter with clear -100 to +100 buy/sell zones.
RSI Scalper delivers split‑second entries on volatile assets.
Are essentially short intervals during which the algorithm seeks liquidity or adjusts price.....
The Structure Fractal indicator is designed to identify and visualize key market structure points
Automatic Elliott Wave Detection with Professional Filters
Get the exact SuperTrend experience from TV, now perfectly rebuilt for cTrader
Chart control panel — zoom presets, timeframe selector, favorite chart buttons, chart type switcher, and bid/ask lines.
Pair Strenght JPY
ICT ALL KİLL ZONES, LONDON , ASİA, NY AM, NY LUNCH, NY PM
Multi-Timeframe Swing Points Indicator for cTrader that identifies swing highs and lows on both the current timeframe.
Anchor a moving average to any point on the chart and watch it extend dynamically as price evolves.
Most used candle patterns. (1 candle, 2 candles and 3 candles patterns) and Marubozu. Bonus Fibo Risk control.
Smart fractals + auto Fibonacci + dynamic S/R zones with HTF confluence & Bull/Bear bias panel. Institutional-grade.
Detects HTF bias using CRT, Expansion & Swing Point patterns with SMT/PSP divergence — visualised in a floating candle
The Floating Risk Indicator is an essential tool for traders who prioritize risk management.
Engulfing candles
show symbol and time fram, daily net profit percent, daily net profit, and spread ln your chart. consider that timezone
135
销售
10.57K
免费安装