
Opis
Klasyczny Proporcjonalny CVD (Zakotwiczony)
Odkryj prawdziwe intencje uczestników rynku dzięki Klasycznemu Proporcjonalnemu CVD. W przeciwieństwie do standardowych wskaźników Kumulatywnej Delty Wolumenu, które po prostu sumują wolumen ticków, to narzędzie wykorzystuje Logikę Proporcjonalną do ważenia wolumenu na podstawie rzeczywistej akcji cenowej w każdej świecy.
Dlaczego "Proporcjonalna" Delta?
Standardowy CVD może być mylący. Ten wskaźnik oblicza deltę, analizując relację między zakresem świecy (High-Low) a odległością Close-Open. Zapewnia to realistyczny rozkład wolumenu:
- Świece o silnym przekonaniu (zamykanie blisko maksimum/minimum) mają większy wkład w deltę.
- Świece z długimi knotami (oznaki absorpcji lub odrzucenia) neutralizują deltę, zapobiegając "fałszywym" sygnałom wolumenu.
Kluczowe cechy
- ⚓ Inteligentne kotwiczenie (reset wielookresowy): Utrzymuj swoją analizę aktualną względem bieżącej sesji handlowej. Wybierz resetowanie obliczeń codziennie, co tydzień lub co miesiąc—lub pozostaw je działające bez przerwy.
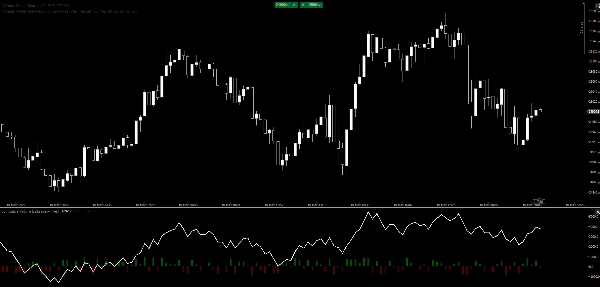
- 📊 Podwójna wizualizacja:
-
- Linia CVD: Czysta, wysokowydajna linia do wykrywania długoterminowych dywergencji i wyczerpania trendu.
- Nakładka histogramu: Natychmiastowa wizualna informacja zwrotna o presji kupna/sprzedaży na każdej świecy, umożliwiająca szybkie rozpoznanie kulminacji lub absorpcji.
- ⚡ Ultra lekki: Napisany z natywną optymalizacją C# dla cTrader, zapewniając zerowe opóźnienia nawet na słabszych komputerach lub na niestabilnych rynkach.
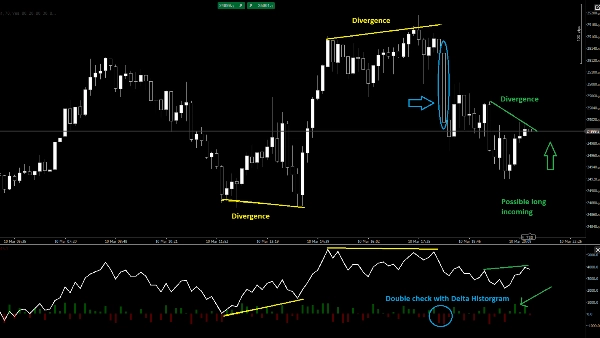
- 🎯 Wykrywanie dywergencji: Łatwo identyfikuj momenty, gdy cena ustanawia nowe maksima, a CVD zawodzi — klasyczny znak dystrybucji instytucjonalnej.
Jak handlować z tym wskaźnikiem
- Potwierdzenie trendu: Obserwuj, czy linia CVD podąża w tym samym kierunku co cena.
- Absorpcja: Gdy cena osiąga nowe minimum, ale histogram CVD pokazuje silny "Delta Up" (zielony), kupujący pochłaniają presję sprzedaży.
- Wyczerpanie: Obserwuj gwałtowny wzrost na histogramie (kulminacja), po którym następuje odwrócenie linii CVD.
Parametry:
- Tryb kotwiczenia: Nigdy, codziennie, co tydzień, co miesiąc.
- Pokaż deltę świecy: Włącz/wyłącz histogram.
Odkryj prawdziwe intencje uczestników rynku dzięki Klasycznemu Proporcjonalnemu CVD. W przeciwieństwie do standardowych wskaźników Kumulatywnej Delty Wolumenu, które po prostu sumują wolumen ticków, to narzędzie wykorzystuje Logikę Proporcjonalną do ważenia wolumenu na podstawie rzeczywistej akcji cenowej w każdej świecy.
Dlaczego "Proporcjonalna" Delta?
Standardowy CVD może być mylący. Ten wskaźnik oblicza deltę, analizując relację między zakresem świecy (High-Low) a odległością Close-Open. Zapewnia to realistyczny rozkład wolumenu:
- Świece o silnym przekonaniu (zamykanie blisko maksimum/minimum) mają większy wkład w deltę.
- Świece z długimi knotami (oznaki absorpcji lub odrzucenia) neutralizują deltę, zapobiegając "fałszywym" sygnałom wolumenu.
Kluczowe cechy
- ⚓ Inteligentne kotwiczenie (reset wielookresowy): Utrzymuj swoją analizę aktualną względem bieżącej sesji handlowej. Wybierz resetowanie obliczeń codziennie, co tydzień lub co miesiąc—lub pozostaw je działające bez przerwy.
- 📊 Podwójna wizualizacja:
-
- Linia CVD: Czysta, wysokowydajna linia do wykrywania długoterminowych dywergencji i wyczerpania trendu.
- Nakładka histogramu: Natychmiastowa wizualna informacja zwrotna o presji kupna/sprzedaży na każdej świecy, umożliwiająca szybkie rozpoznanie kulminacji lub absorpcji.
- ⚡ Ultra lekki: Napisany z natywną optymalizacją C# dla cTrader, zapewniając zerowe opóźnienia nawet na słabszych komputerach lub na niestabilnych rynkach.
- 🎯 Wykrywanie dywergencji: Łatwo identyfikuj momenty, gdy cena ustanawia nowe maksima, a CVD zawodzi — klasyczny znak dystrybucji instytucjonalnej.
Jak handlować z tym wskaźnikiem
- Potwierdzenie trendu: Obserwuj, czy linia CVD podąża w tym samym kierunku co cena.
- Absorpcja: Gdy cena osiąga nowe minimum, ale histogram CVD pokazuje silny "Delta Up" (zielony), kupujący pochłaniają presję sprzedaży.
- Wyczerpanie: Obserwuj gwałtowny wzrost na histogramie (kulminacja), po którym następuje odwrócenie linii CVD.
Parametry:
- Tryb kotwiczenia: Nigdy, codziennie, co tydzień, co miesiąc.
- Pokaż deltę świecy: Włącz/wyłącz histogram.
Podsumowanie
Key features include smart anchoring with multi-timeframe resets (daily, weekly, monthly, or continuous), dual visuals comprising a CVD line for spotting divergences and trend exhaustion, and a histogram overlay for immediate per-bar buying or selling pressure insights. The indicator is optimized in native C# for cTrader, ensuring high performance and low resource use.
Traders can use the indicator for trend confirmation by aligning CVD direction with price, identify absorption when price lows coincide with strong positive delta in the histogram, and detect exhaustion through histogram spikes followed by CVD reversals. Adjustable parameters include anchor mode and histogram display toggle.
This tool supports analysis across multiple markets and symbols, including Forex, cryptocurrencies, indices, commodities, and stocks.
Opinie klientów
5 | 0 % | |
4 | 100 % | |
3 | 0 % | |
2 | 0 % | |
1 | 0 % |


![Logo „[Stellar Strategies] Inside Bar with Signals”](https://cdn.ctrader.com/image/webp/1d9e8bfa-3b2c-4440-bb37-5856902008a7_30683)