
Beschreibung
VWAP (Volume Weighted Average Price) ist ein Handelsmaßstab, der den durchschnittlichen Preis eines Vermögenswerts berechnet, gewichtet nach dem Handelsvolumen über einen bestimmten Zeitraum. Er wird häufig von Daytradern, Institutionen und algorithmischen Handelssystemen verwendet, um den fairen Wert zu bewerten und die Ausführung von Trades zu optimieren.
Wichtige Formel:
VWAP=∑(Price×Volume)/∑Volume
- Preis = Typischer Preis (Hoch + Tief + Schluss) / 3 oder einfach Schlusskurs.
- Volumen = Handelsvolumen für jeden Zeitraum.
2. Warum VWAP verwenden?
Zweck:
1)Referenz für fairen Wert
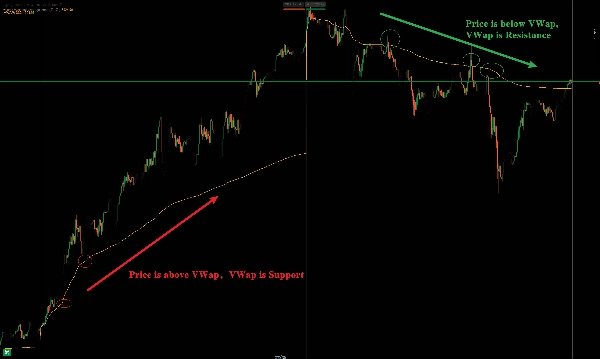
Preis > VWAP = bullische Tendenz; Preis < VWAP = bärische Tendenz.
2)Dynamische Unterstützung/Widerstand
Dient als Schlüsselniveau für Intraday-Ausbrüche/-Umkehrungen.
3) Trendbestätigung
Preis hält sich über VWAP = Aufwärtstrend; darunter = Abwärtstrend.
Volume Weighted Average Price (VWAP) 指标详解及用法
1. 基本概念
VWAP(成交量加权平均价) 是一种技术分析工具,用于衡量资产在特定时间段内的平均交易价格,并根据成交量进行加权计算。它帮助交易者判断当前价格相对于市场的“公平价值”,常用于日内交易、算法交易和机构执行订单。
核心公式:
VWAP=∑(Price×Volume)/∑Volume
每条K线的价格 × 成交量累加,再除以总成交量,得到动态加权均价。
2. VWAP 的主要用途
用途:
1)判断市场公允价格
价格高于VWAP = 偏强;低于VWAP = 偏弱。
2)支撑/阻力参考
VWAP常作为短线交易的动态支撑/阻力位。
3)日内趋势确认
价格持续在VWAP上方 = 多头主导;下方 = 空头主导。
Zusammenfassung
VWAP serves several key functions: it acts as a reference for fair value, where prices above VWAP indicate bullish bias and below indicate bearish bias; it provides dynamic support and resistance levels useful for intraday breakouts and reversals; and it helps confirm intraday trends, with prices sustained above VWAP signaling an uptrend and below signaling a downtrend.
This indicator supports various markets including forex, stocks, indices, commodities, and cryptocurrencies, making it a versatile tool for intraday market analysis and trading strategy development.


