
Beschreibung
📈 Dieser Indikator ist ein Werkzeug, das uns hilft, die Richtung des Trends in einem Preischart zu erkennen und zu visualisieren. 📊 Seine Funktionsweise basiert auf der Berechnung von Trendniveaus mithilfe exponentieller gleitender Durchschnitte und einer Volatilitätsmessung, um die Zonen zu bestimmen, in denen sich der Preis voraussichtlich bewegen wird. Im Folgenden erkläre ich detailliert, wie er funktioniert:
📐 Berechnung der Trendniveaus
Der Indikator beginnt mit der Berechnung des sogenannten "Basisniveaus". Dieses Niveau wird durch den Durchschnitt von zwei exponentiellen gleitenden Durchschnitten ermittelt: einem kurzfristigen (basierend auf einer benutzerdefinierten Länge, in diesem Fall 222) und einem langfristigen (doppelte Länge des ersten). Diese Durchschnitte geben uns eine Referenz für den Gesamtrend.
Anschließend wird die Volatilität anhand der Standardabweichung der Schlusskurse berechnet, und dieser Wert wird mit einem zusätzlichen exponentiellen gleitenden Durchschnitt geglättet. Die geglättete Volatilität wird mit einem Parameter namens "Sensitivität" multipliziert, der uns die oberen und unteren Niveaus um das Basisniveau herum liefert. Diese Niveaus fungieren als Trendbänder und helfen dabei zu erkennen, ob der Preis über oder unter dem Trend liegt.
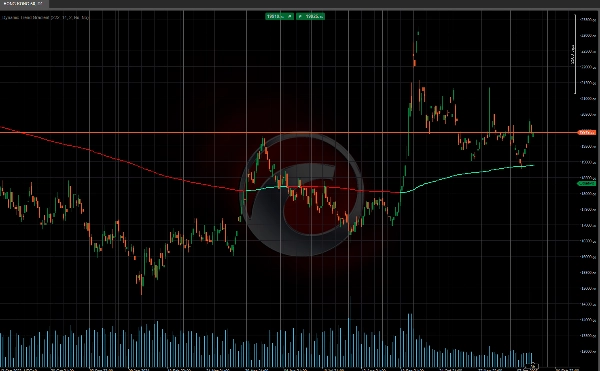
📉📈 Trendstatus
Mit diesen berechneten Niveaus bewertet der Indikator den Trendstatus am Markt. Liegt der Preis über dem Basisniveau, nimmt er einen bullischen Trend 🐂 an, und wenn er darunter liegt, ist der Trend bärisch 🐻. Überschreitet der Preis die oberen oder unteren Niveaus, ändert der Indikator sein Trendsignal und weist auf eine mögliche Umkehr oder Verschiebung der Marktdynamik hin.
Dieses Werkzeug ist perfekt für Trader, die Markttrends voraus sein wollen! 🚀📉📈
Ctrader Store Indikatoren:
Dynamic Market Structure
Analyse von Wendepunkten
Fibonacci Linear
Regression Multi-Timeframe
Multi-Level Candle Bias
Tracker
Auto Support and
Resistance Trend Lines
Zusammenfassung
Kundenbewertungen
5 | 0 % | |
4 | 100 % | |
3 | 0 % | |
2 | 0 % | |
1 | 0 % |


![„[Hamster-Coder] Moving Average MTF“-Logo](https://cdn.ctrader.com/image/webp/b11b98b1-194d-4b8e-b00e-d611826ad159_31226)
