
Beschreibung
Die Jurik-Glättung umfasst 3 Stufen:
1. Stufe - vorläufige Glättung durch adaptive EMA: MA1 = (1-alpha)*Price + alpha*MA1[1];
2. Stufe - eine weitere vorläufige Glättung durch Kalman-Filter: Det0 = (Price - MA1)*(1-beta) + beta*Det0[1]; MA2 = MA1 + PR*Det0;
3. Stufe - endgültige Glättung durch einzigartigen Jurik-adaptiven Filter: Det1 = (MA2 - JMA[1]) * (1-alpha)^2 + alpha^2 * Det1[1]; JMA = JMA[1] + Det1;
wobei: - Price - Preisreihe - alpha - dynamischer Faktor (wird unten beschrieben) - beta - periodisches Verhältnis = 0.45*(Length-1)/(0.45*(Length-1)+2) - PR - Phasenverhältnis: PR = Phase/100 + 1.5 (wenn Phase < -100 dann PR=0.5, wenn Phase > 100 dann PR=2.5).
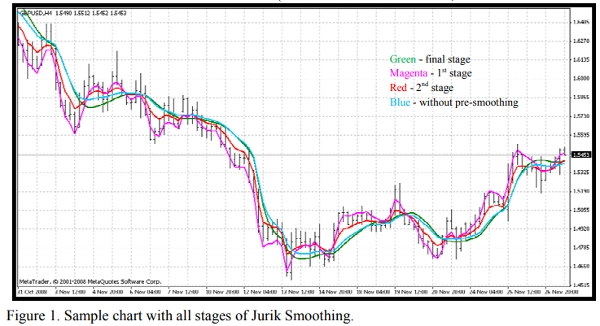
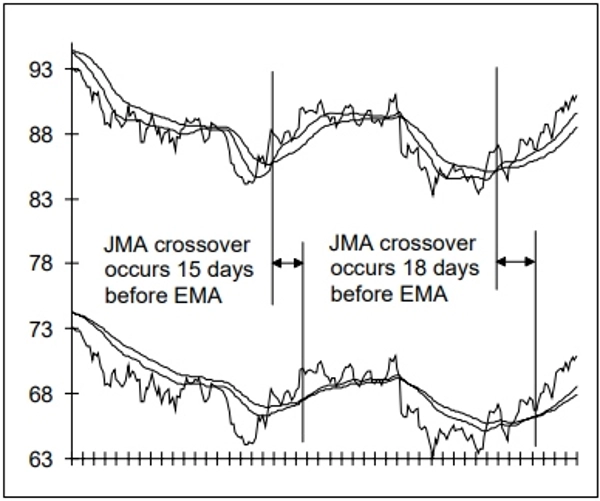
Abbildung 1. Beispielchart mit allen Stufen der Jurik-Glättung. Sie können die Ergebnisse (Abbildung 1) jeder Stufe anhand des beigefügten Indikators JurikFilter_v2 sehen, indem Sie FilterMode ändern: 0 - Endstufe (JMA) 1 - 1. Stufe 2 - 2. Stufe 3 - nur finale (ohne vorläufige) Glättung.
Der dynamische Faktor ist ein periodischer Faktor (beta), der potenziert wird (pow):
alpha = beta ^ Pow,
wobei: - pow = rVolty ^ pow1 - rVolty - relative Preisvolatilität - pow1 - Potenz der relativen Volatilität mit folgender Formel: pow1 = len1 - 2 (wenn pow1 < 0.5 dann pow1 = 0.5),
wobei len1 - zusätzlicher periodischer Faktor: len1 = Log(SquareRoot(len))/Log(2.0) + 2 (wenn len1 < 0 dann len1 = 0).
Somit sieht man, dass der dynamische Faktor auf der relativen Preisvolatilität basiert und die erforderliche Anpassungsfähigkeit für diese Art von Preisfilter bietet.
Die Formel für die relative Preisvolatilität lautet rVolty = Volty/AvgVolty (wenn rVolty > len1^(1/pow1) dann rVolty = len1^(1/pow1), wenn rVolty < 1 dann rVolty = 1),
wobei:
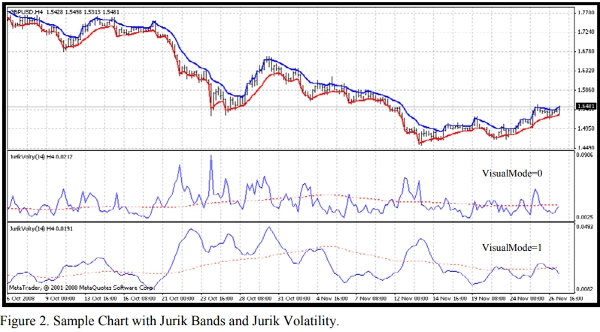
- Volty - Preisvolatilität basierend auf der Berechnung der sogenannten Jurik-Bänder (VisualMode = 1).
- AvgVolty - durchschnittliche Volatilität, für die Jurik einen recht komplexen Berechnungsalgorithmus verwendet: AvgVolty = Average(vSum,AvgLen),
wobei:
- vSum - inkrementelle Summe von (Volty - Volty[10])/10;
- AvgLen - Durchschnittsperiode (Jurik verwendet 65).
In meiner Version des Jurik-Filters verwende ich einfachen Durchschnitt anstelle von Juriks komplexer Mittelung
Außerdem können Sie mit dem beigefügten Indikator JurikVolty_v1 (Abbildung 2) Werte für Volty (VisualMode=0), vSum (VisualMode=1) und AvgVolty (rote gepunktete Linie) sehen.
Die Formel für die Preisvolatilität lautet Volty = max zwischen Abs(del1) und Abs(del2), wenn Abs(del1) = Abs(del2) dann Volty = 0,
wobei: - del1 - Abstand zwischen Preis und oberem Band del1 = Price - UpperBand - del2 - Abstand zwischen Preis und unterem Band del2 = Price - LowerBand Die Jurik-Bänder unterscheiden sich von allen bekannten Preisbändern wie Bollinger, Keltner, Donchian, Fractal und so weiter: wenn del1 > 0 dann UpperBand = Price sonst UpperBand = Price - Kv*del1 wenn del2 < 0 dann LowerBand = Price sonst LowerBand = Price - Kv*del2,
wobei: - Kv - Volatilitätsfaktor Kv = bet ^ SquareRoot(pow2). Es ist leicht zu erkennen, dass diese Bänder eine Grundlage für Trendfolgeindikatoren wie Wilders Parabolic sein können. Somit sieht man, dass wir praktisch keine unklaren Stellen im Algorithmus des Jurik Moving Average (JMA) haben
Zusammenfassung
Kundenbewertungen
5 | 0 % | |
4 | 100 % | |
3 | 0 % | |
2 | 0 % | |
1 | 0 % |


