
FZ
Indikator
Version 1.0, Mar 2026
Windows, Mac
4.0
Bewertungen: 2
Beschreibung
FZ-Indikator für cTrader
Beschreibung
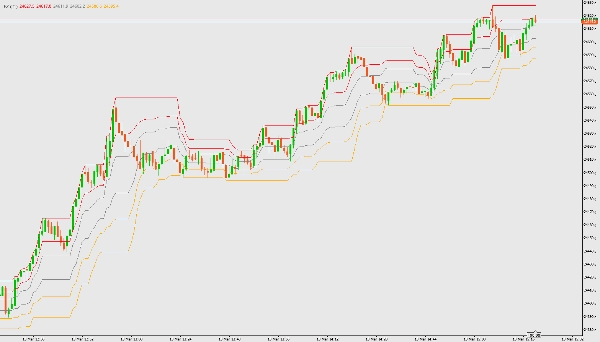
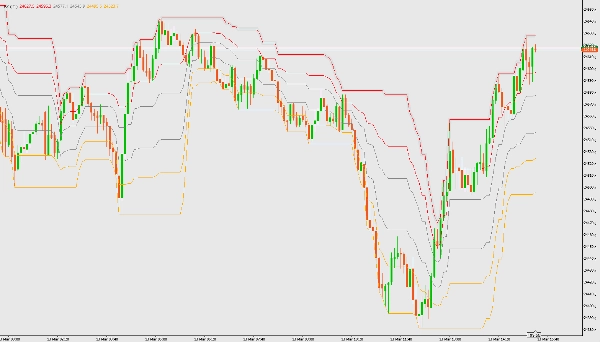
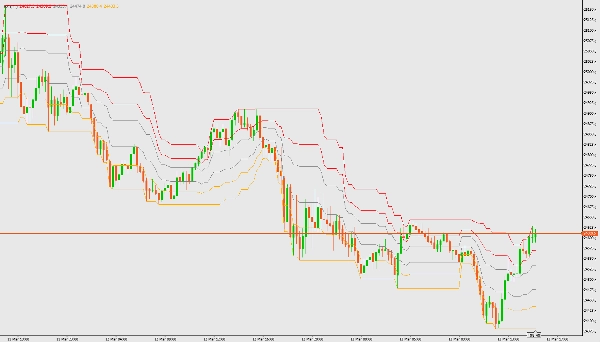
Der FZ-Indikator zeichnet Fibonacci-Kanalzonen basierend auf den höchsten und niedrigsten Preisen über einen benutzerdefinierten Zeitraum. Er hilft dabei, Trendzonen und potenzielle Umkehrbereiche zu identifizieren.
Funktionen
- Berechnet Kanalgrenzen und Fibonacci-Niveaus (0.236, 0.382, 0.618, 0.786)
- Visualisiert Aufwärts-, Seitwärts- und Abwärtstrendzonen
- Überlagerung auf dem Preischart
Parameter
- Berechnung für die letzten ## Balken: Anzahl der Balken für die Berechnung (Standard: 21)
Anleitung
- Laden Sie die FZ-Indikator-Datei (FZ.cs) herunter und fügen Sie sie Ihrer cTrader-Plattform hinzu.
- Kompilieren Sie den Indikator in cTrader Automate.
- Fügen Sie den Indikator einem beliebigen Chart hinzu.
- Passen Sie den Parameter für die Anzahl der Balken nach Bedarf an.
- Interpretieren Sie die farbigen Zonen:
-
- Cyan: Aufwärts-Trendzone (Long gehen)
- Grau: Seitwärtszone (auf Trendwechsel warten)
- Orange: Abwärts-Trendzone (Short gehen)
Zusammenfassung
Indikatorprofil
Kundenbewertungen
4.0
Bewertungen: 2
5 | 0 % | |
4 | 100 % | |
3 | 0 % | |
2 | 0 % | |
1 | 0 % |
Diskussion
Häufig gestellte Fragen (FAQ)
BTCUSD
Forex
Signal
Breakout
Indices
EURUSD
Commodities
GBPUSD
NZDUSD
Prop
Scalping
Crypto
Grid
Stocks
AI
XAUUSD
NAS100
USDJPY
Über den cTrader Store verfügbare Produkte, einschließlich Handelsbots, Indikatoren und Plugins, werden von externen Entwicklern bereitgestellt und nur zu Informations- und technischen Zugriffszwecken verfügbar gemacht. cTrader Store ist kein Broker und erbringt keine Anlageberatung, persönlichen Empfehlungen oder eine Garantie für zukünftige Performance.
Mehr von diesem Autor


![„Smart Money Concepts (SMC) [Iridio Capital]“-Logo](https://cdn.ctrader.com/image/webp/28b69fd1-ef54-4bed-9487-07e78e883be4_40934)


Preis
Seit 10/03/2026
105
Kostenlose Installationen