
Descrizione
Panoramica
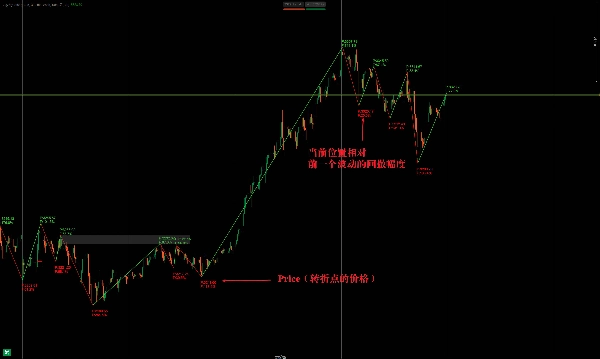
L'indicatore ZigZag è uno strumento di analisi tecnica utilizzato principalmente per identificare i punti chiave di inversione del prezzo filtrando il rumore di mercato. Collega massimi e minimi significativi con linee ZigZag, aiutando i trader a visualizzare le tendenze e potenziali breakout.
Come funziona ZigZag
- Funzionalità principale
-
- Elimina le fluttuazioni minori del prezzo impostando una soglia minima di variazione del prezzo (percentuale o valore fisso).
- Collega solo i massimi/minimi significativi, semplificando l'analisi della tendenza.
- Spesso usato per rilevare livelli di supporto/resistenza, inversioni (es. testa e spalle, doppi massimi/minimi).
- Parametri chiave
-
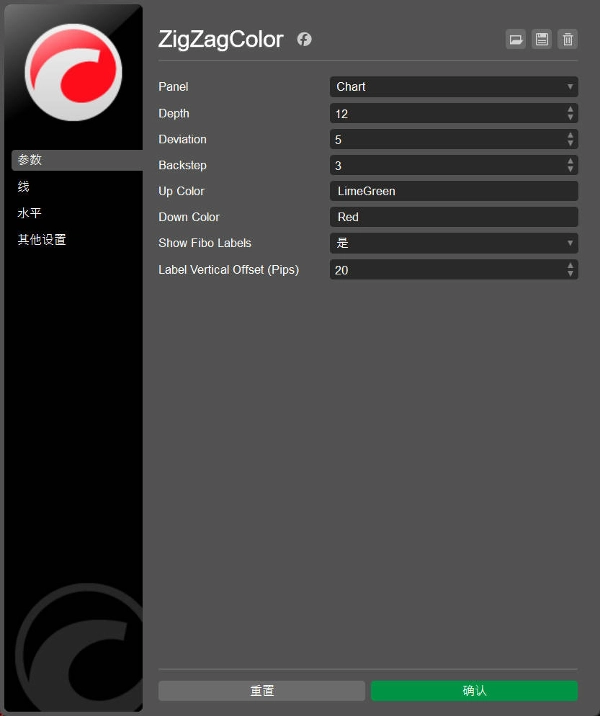
- Movimento minimo del prezzo (%): Determina la sensibilità (es. 5% ignora movimenti inferiori a questo valore).
- Profondità di analisi: Controlla quante candele passate vengono analizzate, influenzando il ritardo.
Applicazioni principali
1. Identificazione della tendenza
- Tendenze rialziste: Massimi più alti (HH) + minimi più alti (HL).
- Tendenze ribassiste: Massimi più bassi (LH) + minimi più bassi (LL).
- Aiuta a tracciare linee di tendenza per potenziali operazioni di breakout.
2. Riconoscimento dei pattern
- Rivela classici pattern grafici (triangoli, bandiere, cunei) definendo i punti di oscillazione.
3. Livelli di ritracciamento di Fibonacci
- Segna chiaramente massimi/minimi per estensioni o ritracciamenti di Fibonacci.
4. Rilevamento delle divergenze
- Evidenzia divergenze tra prezzo e oscillatori (RSI, MACD).
L'indicatore ZigZag è uno strumento di analisi tecnica utilizzato principalmente per identificare i punti chiave di inversione del prezzo, aiutando i trader a filtrare il rumore di mercato e a evidenziare massimi e minimi importanti. Di seguito sono riportati i suoi punti chiave e il suo utilizzo:
Principio dell'indicatore ZigZag
- Funzionalità di base:
-
- Ignora automaticamente le piccole oscillazioni impostando una soglia di variazione del prezzo (percentuale o valore fisso), collegando solo massimi e minimi significativi per formare una linea a zigzag.
- Spesso utilizzato per aiutare a identificare livelli di supporto/resistenza e inversioni di tendenza (come testa e spalle, doppi minimi, ecc.).
- Parametri principali:
-
- Ampiezza minima della variazione (ad esempio 5% o punti): determina la sensibilità al filtraggio delle piccole oscillazioni. Valori più alti producono meno segnali ma più affidabili.
- Profondità di analisi: controlla il numero di candele di riferimento nel calcolo, influenzando il ritardo nell'identificazione dei punti di inversione.
Principali utilizzi
- Identificazione della tendenza:
-
- Determina la direzione della tendenza tramite massimi crescenti (tendenza al rialzo) o minimi decrescenti (tendenza al ribasso).
- Combinato con linee di tendenza, può anticipare breakout o ritracciamenti.
- Analisi dei pattern:
-
- Identifica pattern di prezzo classici (come triangoli, bandiere), le linee ZigZag mostrano chiaramente i confini del pattern.
- Integrazione con strumenti di Fibonacci:
-
- Utilizza i massimi/minimi segnati da ZigZag come punti di partenza/fine per ritracciamenti o estensioni di Fibonacci.
- Rilevamento delle divergenze:
-
- Quando il prezzo e gli indicatori (come RSI, MACD) divergono, ZigZag aiuta a confermare i punti di inizio e fine della divergenza.


