
Beschreibung
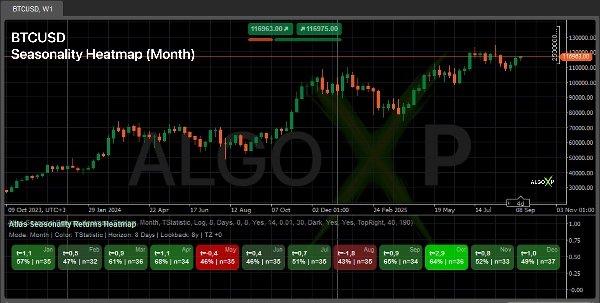
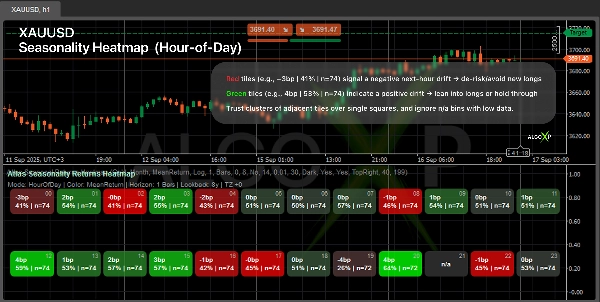
🧭 Timen Sie Ihre Trades nach der Uhr: Atlas zeigt, wann sich die Märkte typischerweise nach Monat, Wochentag und Stunde bewegen. 🧭
Sehen Sie, wann sich Ihr Markt typischerweise bewegt – nach Monat, Wochentag oder Tagesstunde.
Atlas berechnet zukünftige Renditen über einen von Ihnen gewählten Zeitraum und erstellt eine symmetrische Heatmap (Abwärts → Null → Aufwärts). Jede Kachel zeigt eine Kennzahl (Mittelwert, T-Statistik oder Sharpe) plus Trefferquote % | n. Verwenden Sie sie, um Einstiege/Ausstiege zu timen, Sitzungen zu planen und Risiken zu filtern.
🎯 Warum Trader es nutzen
- Erkennen Sie grüne Fenster, um einzusteigen, und rote Fenster, um auszusteigen.
- Planen Sie Sitzungen um statistisch günstige Stunden/Tage herum.
- Fügen Sie eine klare „Wann“-Ebene zu diskretionären und systematischen Strategien hinzu.
⚙️ Wie es funktioniert
- Blickt voraus über ein von Ihnen gewähltes Fenster und fasst zusammen, wie sich der Preis in diesem Fenster typischerweise verhält.
- Gruppiert die Ergebnisse in Zeitabschnitte (Monat / Wochentag / Stunde) und berücksichtigt Ihre Zeitzone.
- Wendet Ausreißerschutz und eine robuste Stärke-Bewertung pro Abschnitt an (plus Stichprobengröße).
- Erstellt eine ausgewogene Heatmap um den neutralen Bereich herum mit Ihren Aufwärts / Null / Abwärts Farben.
👥 Für wen es gedacht ist
- Diskretionäre Trader — bessere Timing- und Positionsgrößenbestimmung pro Sitzung.
- System- & Bot-Entwickler — eine Zeitfilter-/Zeitgrößenanpassung Ebene für Strategien.
- Krypto- & Index-Trader — schnelle Verhaltensmuster über Tage/Stunden.
- Anfänger — einfache Lesart: grüner = positiverer Bias über Ihren gewählten Zeitraum.
🚀 Schnellstart
- Wählen Sie Asset-Voreinstellung (Forex/Krypto/Index/Gold).
- Stellen Sie den Zeithorizont ein (z.B. 1 Stunde für HOD, 1 Tag für DOW/Monat).
- Passen Sie Lookback, Minimale Beobachtungen und Farben an.
- Lesen Sie Cluster (mehrere angrenzende grüne/rote Kacheln) für die stärksten Hinweise.
ℹ️ Saisonalität ist keine Garantie für zukünftige Ergebnisse. Es ist ein statistisches Muster, das von Zeitraum und Methodik abhängt. Verwenden Sie den Indikator als Kontext für Ihre Ein- und Ausstiegsregeln sowie das Risikomanagement, testen Sie Robustheit über mehrere Lookback-Fenster und vermeiden Sie die Abhängigkeit von Bins mit geringer Stichprobengröße (n).
Zusammenfassung
The indicator supports multiple asset presets including Forex, Crypto, Indices, and Commodities, and respects the user’s timezone. It applies outlier protection and calculates a robust strength score per time bucket to ensure reliable insights. Users can customize parameters like lookback period, minimum observations, and color schemes.
Atlas is suitable for discretionary traders seeking better timing and sizing, system and bot builders needing a time-based filter or sizing layer, crypto and index traders analyzing behavioral patterns, and beginners looking for a straightforward indication of positive or negative market bias. It provides a statistical context for entry/exit decisions and risk management but should be used alongside other analysis tools.
Kundenbewertungen
5 | 50 % | |
4 | 50 % | |
3 | 0 % | |
2 | 0 % | |
1 | 0 % |


