
LT_Ind_VWAP
Indikator
2 käufe
Version 1.0, Oct 2025
Windows, Mac
4.5
Bewertungen: 2
Beschreibung
Hinweis: Getestet nur auf cTrader Windows.
LT_Ind_VWAP ist ein praktischer verankerter VWAP-Indikator für cTrader.
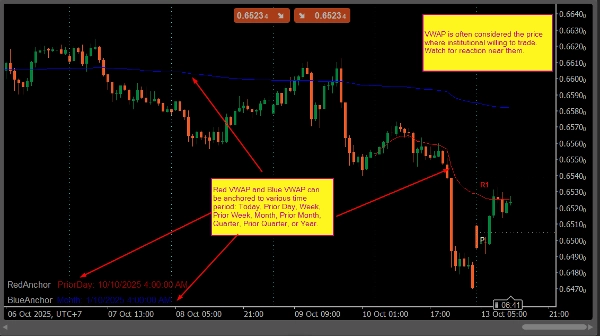
Er zeichnet zwei VWAP-Linien (Rot und Blau), die jeweils an einen ausgewählten Zeitraum verankert werden können, wie zum Beispiel Heute, Vortag, Woche, Vorwoche, Monat, Vormonat, Quartal, Vorquartal oder Jahr.
Der Indikator berechnet automatisch neu, wenn ein neuer Tag beginnt, und zeigt den aktiven Anker sowie das Datum direkt im Chart an. Er ist für Trader konzipiert, die VWAP-Niveaus zur Verfolgung von fairem Wert, Trendrichtung oder Mean-Reversion-Bereichen verwenden.
Hauptmerkmale
- Zwei VWAP-Linien mit unabhängigen Ankern
- Unterstützte Anker: Heute, Vortag, Woche, Vorwoche, Monat, Vormonat, Quartal, Vorquartal, Jahr
- Automatische Neuberechnung bei Sitzungswechsel
- Ankerinformationen im Chart angezeigt
- Einfache Einrichtung, minimaler Ressourcenverbrauch
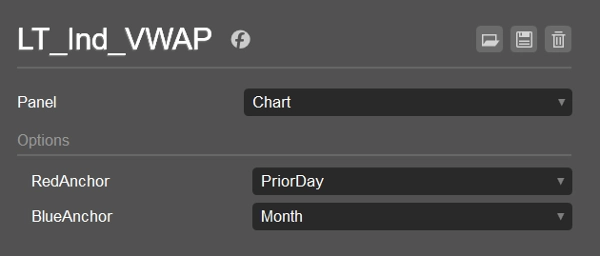
Standardeinstellungen
- Roter VWAP: Vortag
- Blauer VWAP: Monat
Anwendungsfälle
- Vergleich des Intraday-Preises mit dem VWAP des Vortags
- Überwachung des monatlichen oder vierteljährlichen VWAP für Swing-Richtung
- Finden von Übereinstimmungen zwischen kurz- und langfristigen VWAP-Niveaus
Zusammenfassung
KI-Zusammenfassung
LT_Ind_VWAP is an anchored VWAP (Volume Weighted Average Price) indicator designed for the cTrader platform (Windows version). It displays two independent VWAP lines—red and blue—each anchored to selectable time periods including Today, Prior Day, Week, Prior Week, Month, Prior Month, Quarter, Prior Quarter, or Year. The indicator automatically recalculates at the start of a new trading session and shows the active anchor and date on the chart for easy reference. Its primary use cases include comparing intraday prices with prior-day VWAP, monitoring monthly or quarterly VWAP for swing trading bias, and identifying confluence between short- and long-term VWAP levels. The default settings anchor the red VWAP to the prior day and the blue VWAP to the current month. LT_Ind_VWAP offers a simple setup with minimal resource consumption, making it suitable for traders who rely on VWAP levels to assess fair value, trend direction, or mean-reversion zones across various markets such as Forex, indices, commodities, cryptocurrencies, and stocks.
Indikatorprofil
Kundenbewertungen
4.5
Bewertungen: 2
5 | 50 % | |
4 | 50 % | |
3 | 0 % | |
2 | 0 % | |
1 | 0 % |
Kundenbewertungen
October 26, 2025
Diskussion
Häufig gestellte Fragen (FAQ)
Prop
Forex
Indices
Commodities
Crypto
Stocks
VWAP
Über den cTrader Store verfügbare Produkte, einschließlich Handelsbots, Indikatoren und Plugins, werden von externen Entwicklern bereitgestellt und nur zu Informations- und technischen Zugriffszwecken verfügbar gemacht. cTrader Store ist kein Broker und erbringt keine Anlageberatung, persönlichen Empfehlungen oder eine Garantie für zukünftige Performance.


Preis
Seit 25/09/2024
34
Verkäufe