
Beschreibung
Volatilitätsausbruch-Indikator - Hawkes Volatility Engine
Dieser Indikator soll Kontext bieten, keine unmittelbaren Handelsaktionen. Die Volatilitätskomponente hilft Ihnen zu erkennen, wann sich die Marktbedingungen ändern – Phasen niedriger Volatilität gehen oft großen Bewegungen voraus, und Phasen hoher Volatilität erschöpfen sich schließlich. Die EWMA-Komponente hält Sie mit dem sich entwickelnden Trend orientiert und hebt hervor, wenn sich der Preis davon entfernt.
Kombinieren Sie diese beiden Perspektiven – Volatilitätsregime und Trendkontext – mit Ihrer eigenen Handelsmethodik und Ihrem Urteilsvermögen. Der Indikator zeigt Ihnen das Umfeld – Sie entscheiden, was Sie darin tun.
Version 2.0
Offen für zukünftige Updates
-----------------------------------------------------------------------------------------------------------------------------------------------------------------------
Überblick
-----------------------------------------------------------------------------------------------------------------------------------------------------------------------
Dieser Indikator kombiniert zwei unterschiedliche Komponenten, um Händlern gleichzeitig Volatilitätsregime und Trendbedingungen zu identifizieren.
Die erste Komponente verwendet einen Hawkes-Prozess, um Veränderungen der Marktvolatilität zu erkennen. Im Gegensatz zu traditionellen Volatilitätsindikatoren sagt er keine Richtung voraus – er signalisiert lediglich, wann der Markt von ruhiger Kompression zu aktiver Volatilität wechselt oder umgekehrt. Man kann ihn als Volatilitätszustandsdetektor betrachten: Er zeigt an, wann es heiß hergeht oder sich abkühlt, aber nicht, in welche Richtung sich der Preis bewegt.
Die zweite Komponente fügt ein doppeltes EWMA-System (Exponentiell gewichteter gleitender Durchschnitt) hinzu, das über Ihrem Kursdiagramm liegt. Dies gibt Ihnen Trendkontext durch ein schnelles und langsames gleitendes Durchschnittskreuz, ergänzt durch eine Kerzenfärbung, die zeigt, wann der Preis vom Trend abweicht.
-----------------------------------------------------------------------------------------------------------------------------------------------------------------------
Wie es funktioniert
-----------------------------------------------------------------------------------------------------------------------------------------------------------------------
Volatilitätserkennung: Der Indikator verwendet den Parkinson High-Low Volatilitäts-Schätzer – eine effizientere Methode als der Standard-ATR, da er die gesamte Kerzen-Spanne nutzt. Diese normalisierte Volatilität fließt in eine Hawkes-Prozess-Berechnung ein, die dann mit dynamischen quantilbasierten Schwellenwerten verglichen wird.
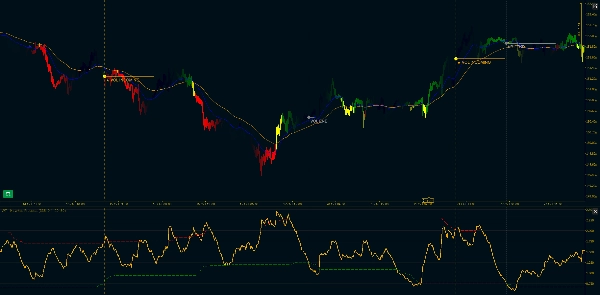
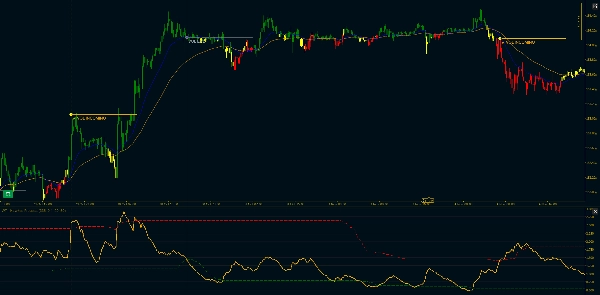
Wenn die Volatilität nach einer Kompressionsphase über die obere Schwelle ausbricht, erhalten Sie ein "VOL INCOMING"-Signal. Wenn sie wieder unter die untere Schwelle fällt, sehen Sie "VOL END". Dies sind keine Einstiegssignale – es sind Volatilitätsregime-Wechsel. Der Markt wacht entweder auf oder schläft ein.
Trendkontext: Zwei exponentiell gewichtete gleitende Durchschnitte (schnell und langsam) erscheinen in Ihrem Hauptchart. Der schnelle GD ist blau, der langsame orange. Wenn der schnelle über dem langsamen liegt, ist der Trend aufwärts. Wenn der schnelle unter dem langsamen liegt, ist der Trend abwärts.
Der Divergenzfilter: Hier wird es interessant. Manchmal entfernt sich der Preis deutlich vom Trend. Wenn die gesamte Kerze (Open, High, Low, Close) während eines Aufwärtstrends unter dem schnellen GD liegt oder während eines Abwärtstrends darüber, wird die Kerze gelb. Dies ist ein strenger Filter – wenn auch nur der Docht den schnellen GD berührt, behält die Kerze die normale Trendfarbe.
Gelbe Kerzen erscheinen oft bei Rücksetzern oder Erschöpfungspunkten, aber denken Sie daran: Sie sagen nicht, was als Nächstes kommt, sondern nur, dass sich der Preis vorübergehend vom Trend entfernt hat.
-----------------------------------------------------------------------------------------------------------------------------------------------------------------------
Hauptmerkmale
-----------------------------------------------------------------------------------------------------------------------------------------------------------------------
Volatilitätskomponente:
- Parkinson High-Low Volatilitätsnormalisierung (effizienter als Standard-ATR-Methode)
- Hawkes-Prozess-Berechnung mit einstellbarem Zerfall (Kappa-Parameter)
- Dynamische quantilbasierte Schwellenwerte (anpassbare Perzentile)
- Visuelle Markierungen: "VOL INCOMING" bei Volatilitätsausbrüchen, "VOL END" bei Kompressionen
- Fortsetzungsfilter: Nur der erste Ausbruch wird markiert, nicht jeder Spike
- Optionale horizontale Trendlinien und vertikale Markierungen
EWMA-Trendkomponente:
- Pandas-kompatible EWMA-Berechnung (adjust=True Formel)
- Schnelle und langsame GD-Linien im Hauptkurschart angezeigt
- Anpassbare Spannenlängen (Standard: 20/50)
- Minimale Periodenunterstützung (unterdrückt Ausgabe bis ausreichende Daten vorliegen)
- Option zum Ignorieren von NA für die Behandlung von Lücken
- Dreifarbiges Kerzensystem: Grün (Aufwärtstrend), Rot (Abwärtstrend), Gelb (Divergenz)
Anpassungsoptionen:
- Parkinson-Periode (Lookback für Volatilitätsberechnung)
- Hawkes Kappa (Zerfallsrate, beeinflusst Sensitivität)
- Quantil-Lookback-Periode
- Niedrige und hohe Volatilitätsschwellen (Perzentile)
- Jahresumrechnungsumschalter und Segmentlänge
- Schnelle und langsame Spanne für gleitende Durchschnitte
- Bullen-, Bären- und Divergenzfarben
- Trendlinienverlängerungslänge
- Vertikale Markierungen ein-/ausblenden
----------------------------------------------------------------------------------------------------------------------------------------------------------------------------
Technische Anmerkung: Die Hawkes-Prozess-Komponente verwendet eine rekursive exponentielle Berechnung, die für die Echtzeitanwendung optimiert ist. Die EWMA-Implementierung entspricht dem Verhalten von Pandas, um Konsistenz mit Python-basierendem Backtesting zu gewährleisten. Beide Komponenten berechnen nur auf geschlossenen Kerzen, um Nachzeichnungen zu vermeiden.
Zusammenfassung
Kundenbewertungen
5 | 100 % | |
4 | 0 % | |
3 | 0 % | |
2 | 0 % | |
1 | 0 % |


